Datadog, JSM, SRE Discovery Tasks, and Chat UX
The March 2026 Aiden release adds Datadog and Jira Service Management (JSM) integrations, automatically creates tasks and skills from SRE Discovery, enhances interactive chat with rich UI elements, and fixes unnecessary Kubernetes subagent pod checks.
Explore the sections below to see what's new, enhanced, and fixed in this update.
| Feature | Link | |
|---|---|---|
| What's New | Integrations | Datadog Integration |
| JSM Integration | ||
| SRE | Tasks and Skills from Discovery | |
| What's Enhanced | Platform | Interactive Chat Experience Enhancements |
| What's Fixed | Agents | Kubernetes Subagent Runs Unnecessary Pod Checks |
What's New
Datadog Integration
Click to view
The Datadog integration supports observability-driven investigation and monitoring. You can query logs, analyze traces, explore metrics, review monitors, track incidents, and manage dashboards, all directly within Aiden. Interact with your Datadog data conversationally for troubleshooting issues, understanding system behavior, and monitoring infrastructure without switching tools.
Typical use case: investigating production issues by querying logs, correlating traces and metrics, identifying root causes, and taking action, without leaving the Aiden interface.
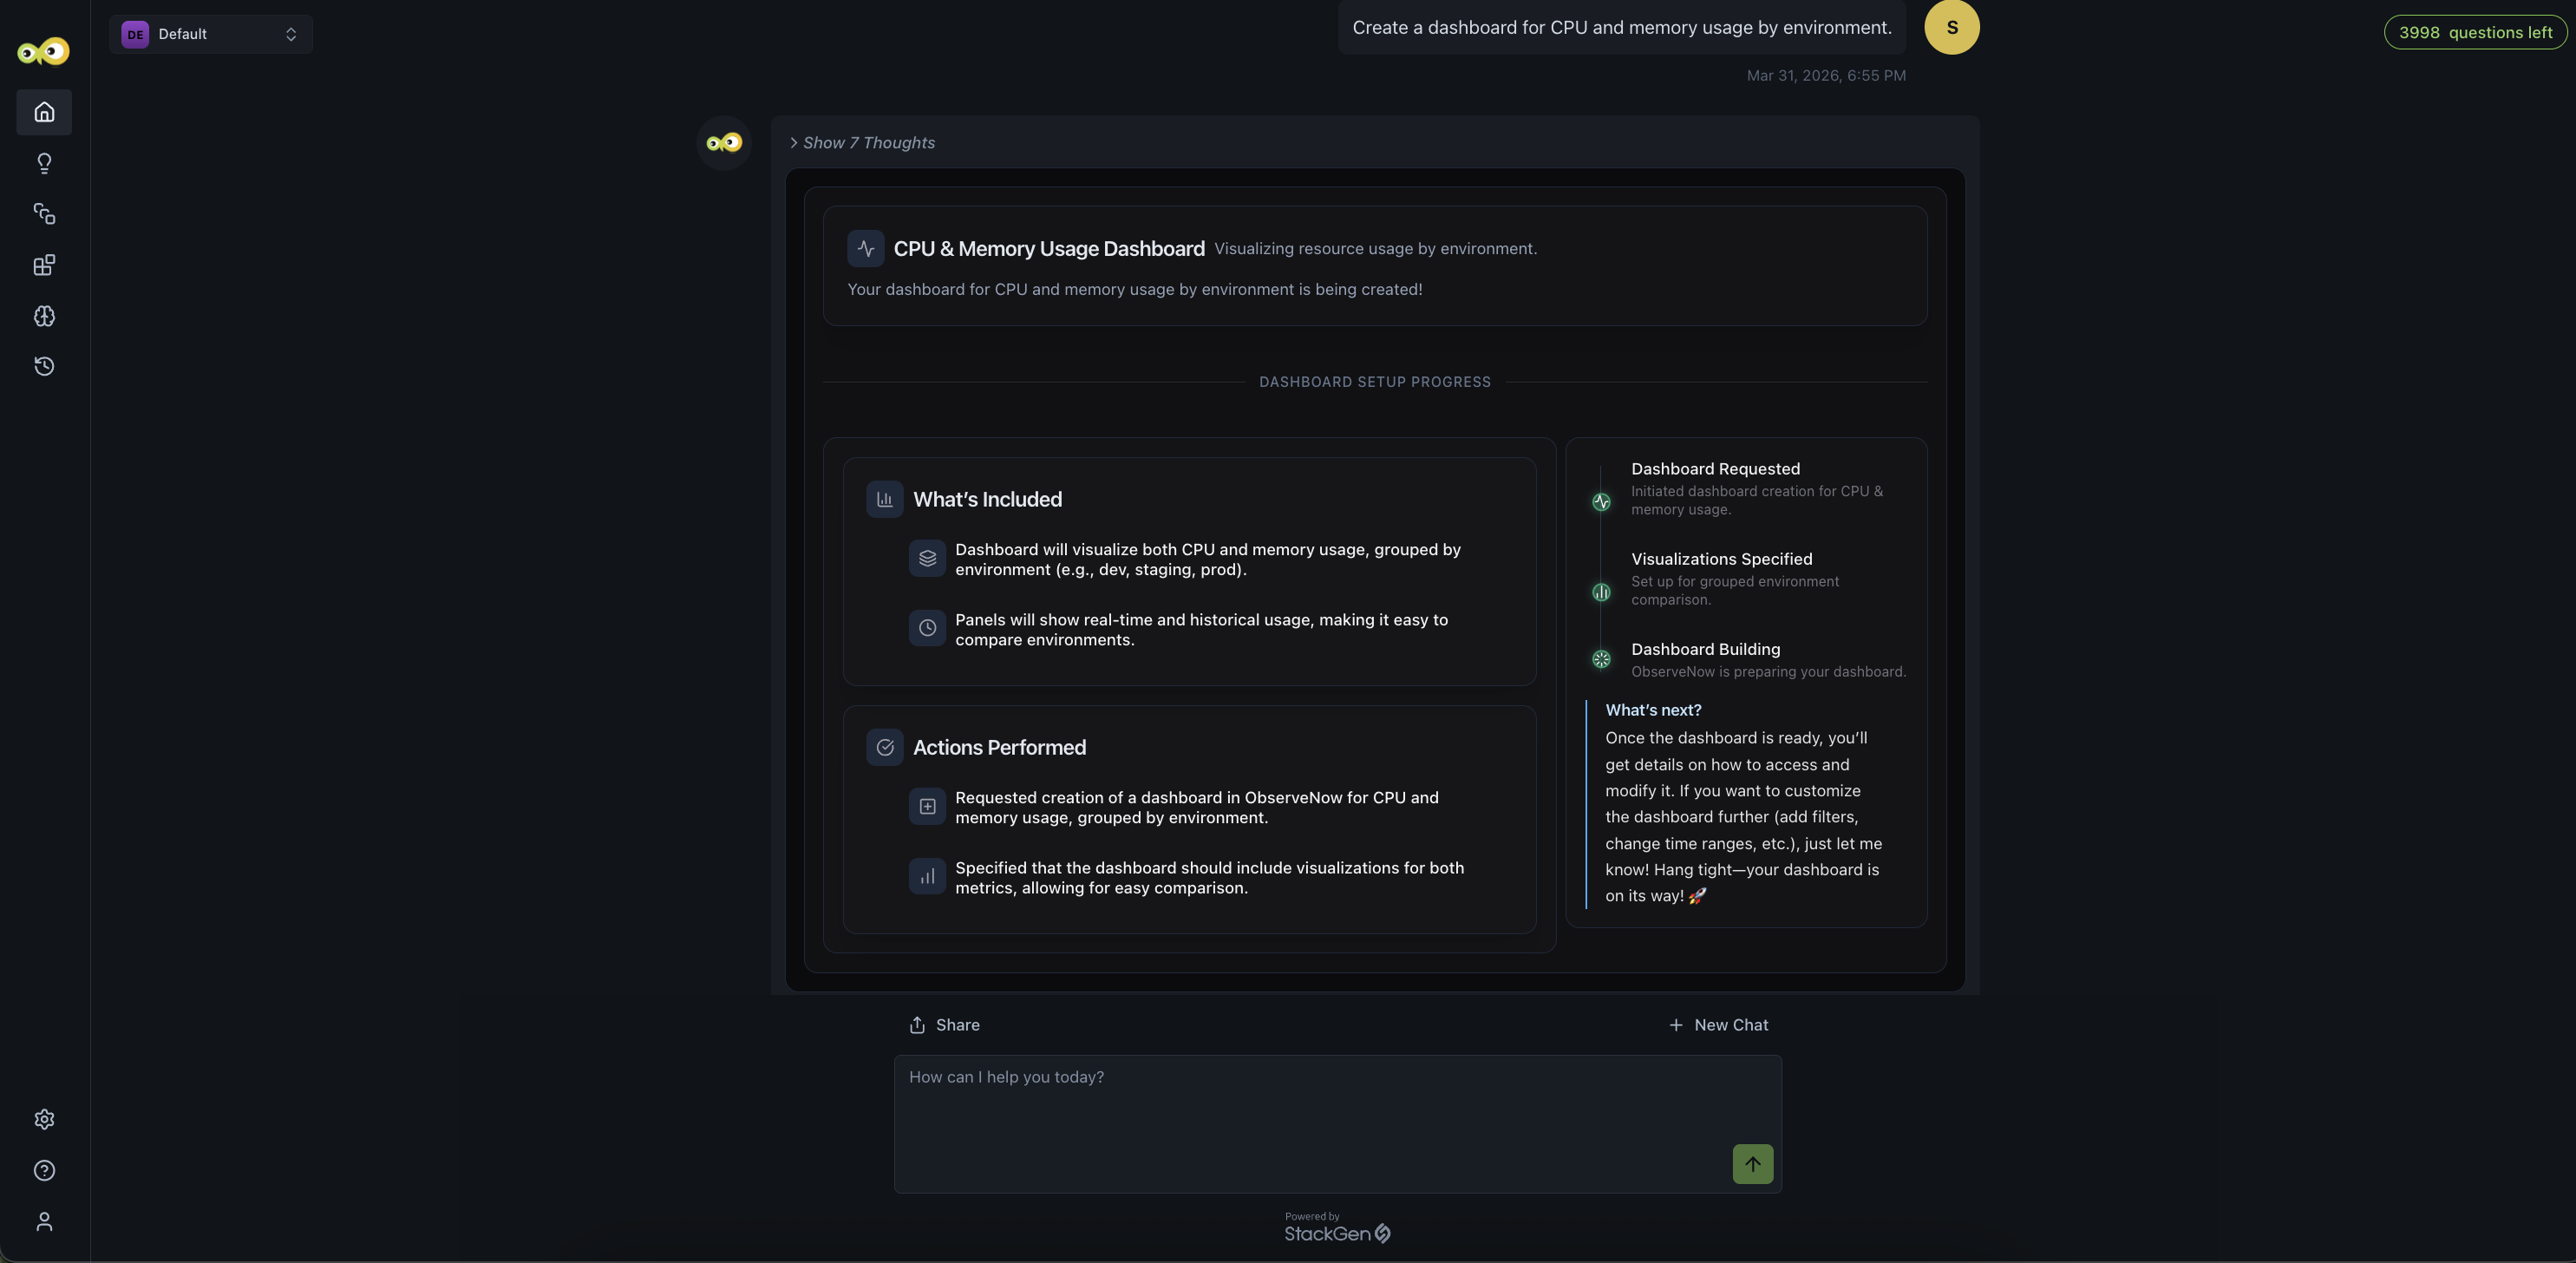
Datadog observability in Aiden lets you:
- Query logs with filters, indexes, and time ranges
- Investigate distributed traces and spans
- Analyze time-series metrics and dashboards
- Review monitors and alert configurations
- Track and investigate incidents
- Monitor infrastructure health and hosts
- Explore CI/CD pipeline events
- Browse service catalog and team metadata
Example prompts
- "Show me error logs from api-service in the last hour"
- "What's causing the latency spike in checkout service?"
- "List all active monitors and their status"
- "Find traces with 5xx errors today"
- "Are there any open incidents?"
Why It Matters
You get unified observability access in Aiden without switching to Datadog. Logs, metrics, traces, and incidents stay in one place, keeping investigation and troubleshooting workflows fast and in context.
Check out the Datadog integration guide to set up and start using the integration.
JSM Integration
Click to view
The Jira Service Management (JSM) integration brings service management, CMDB, SLAs, and on-call context into your workflows. You can search assets, check SLA status, query the Knowledge Base, and view alerts or on-call schedules without leaving the Aiden interface.
Interact with your JSM data conversationally to investigate issues, understand service context, and respond faster without switching tools.
Typical use case: incident investigation and support workflows, checking SLA status, identifying impacted assets, finding relevant Knowledge Base articles, and routing issues to the right on-call engineer.
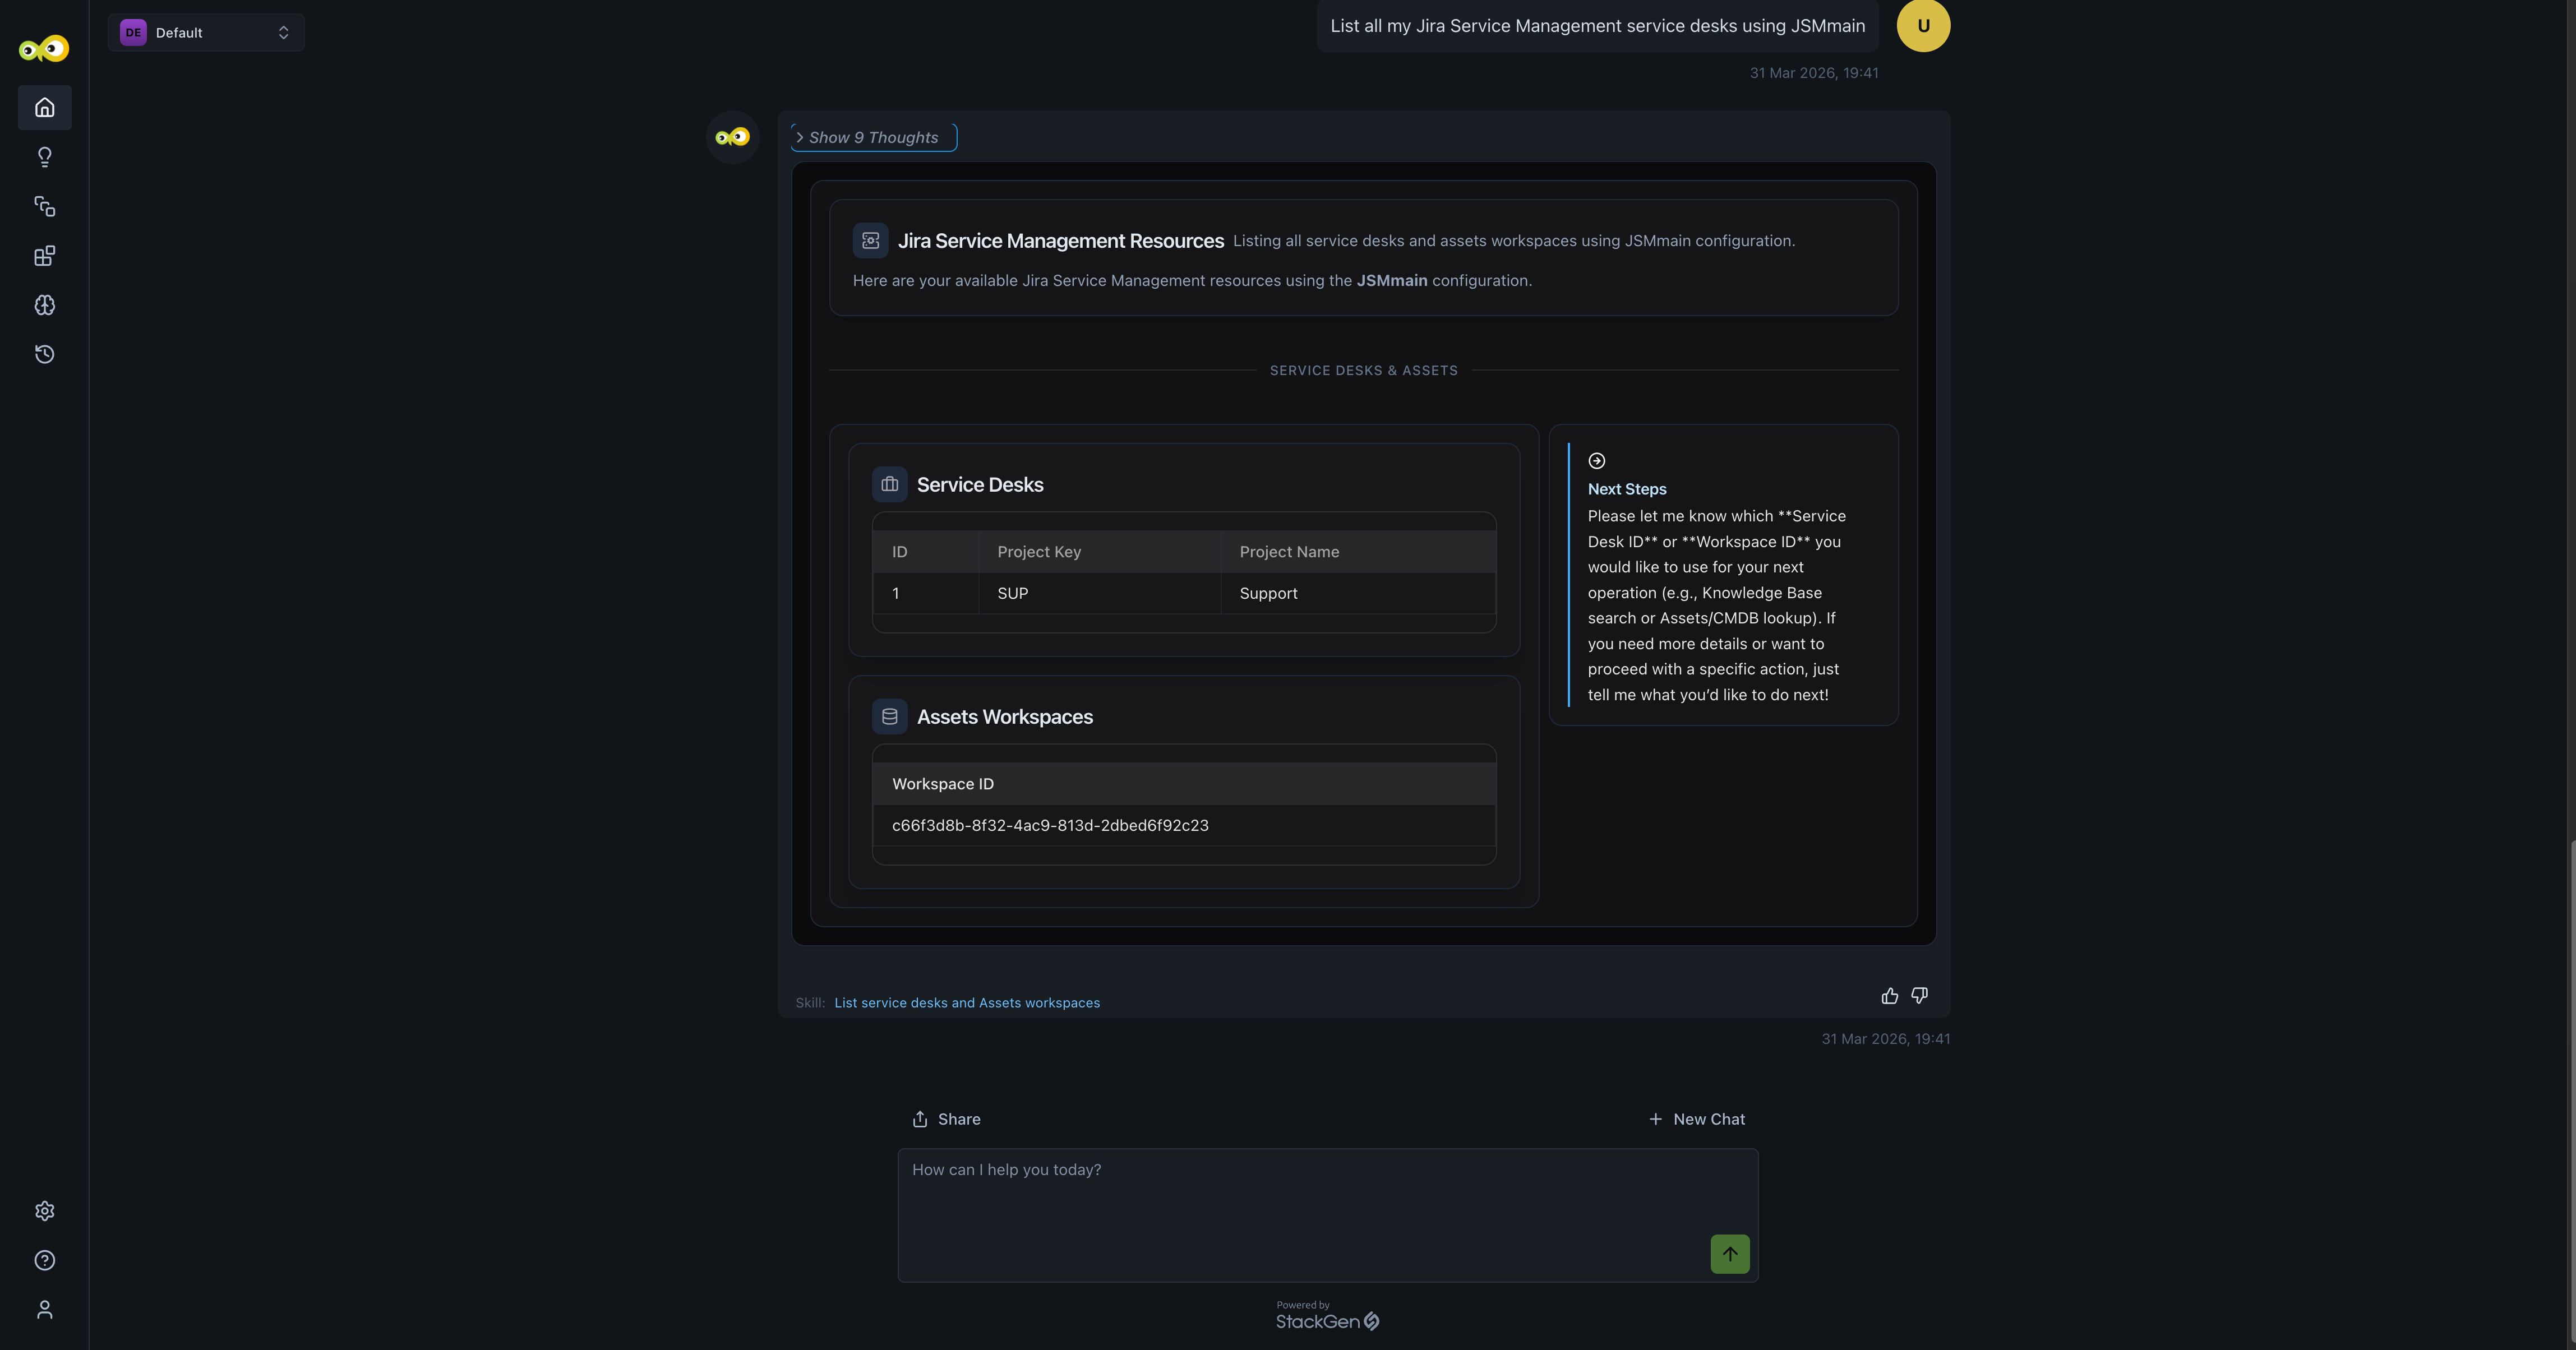
JSM capabilities in Aiden:
- List service desks and access Knowledge Base content
- Search articles across service desks
- Check SLA status (breached, time remaining) for issues
- Explore Assets (CMDB) with AQL-based queries
- Retrieve detailed asset and configuration item information
- List Opsgenie alerts (if configured)
- View on-call schedules and current responders
Example prompts
- "Who is on call right now?"
- "List open Opsgenie alerts"
- "What's the SLA status for SUP-123?"
- "Search Knowledge Base for password reset"
- "Find laptops in Assets with name containing dev"
- "Are there any breached SLAs for Help Desk?"
Why It Matters
You get unified service management context in Aiden without switching to JSM. Assets, SLAs, knowledge, and on-call data stay in one place, keeping support and incident workflows fast and in context.
Check out the JSM integration guide to set up and start using the integration.
Tasks and Skills from Discovery
Click to view
Aiden SRE Discovery now does more than show you what's running in your environment. It also sets up the tasks and skills you need to act on that information, automatically.
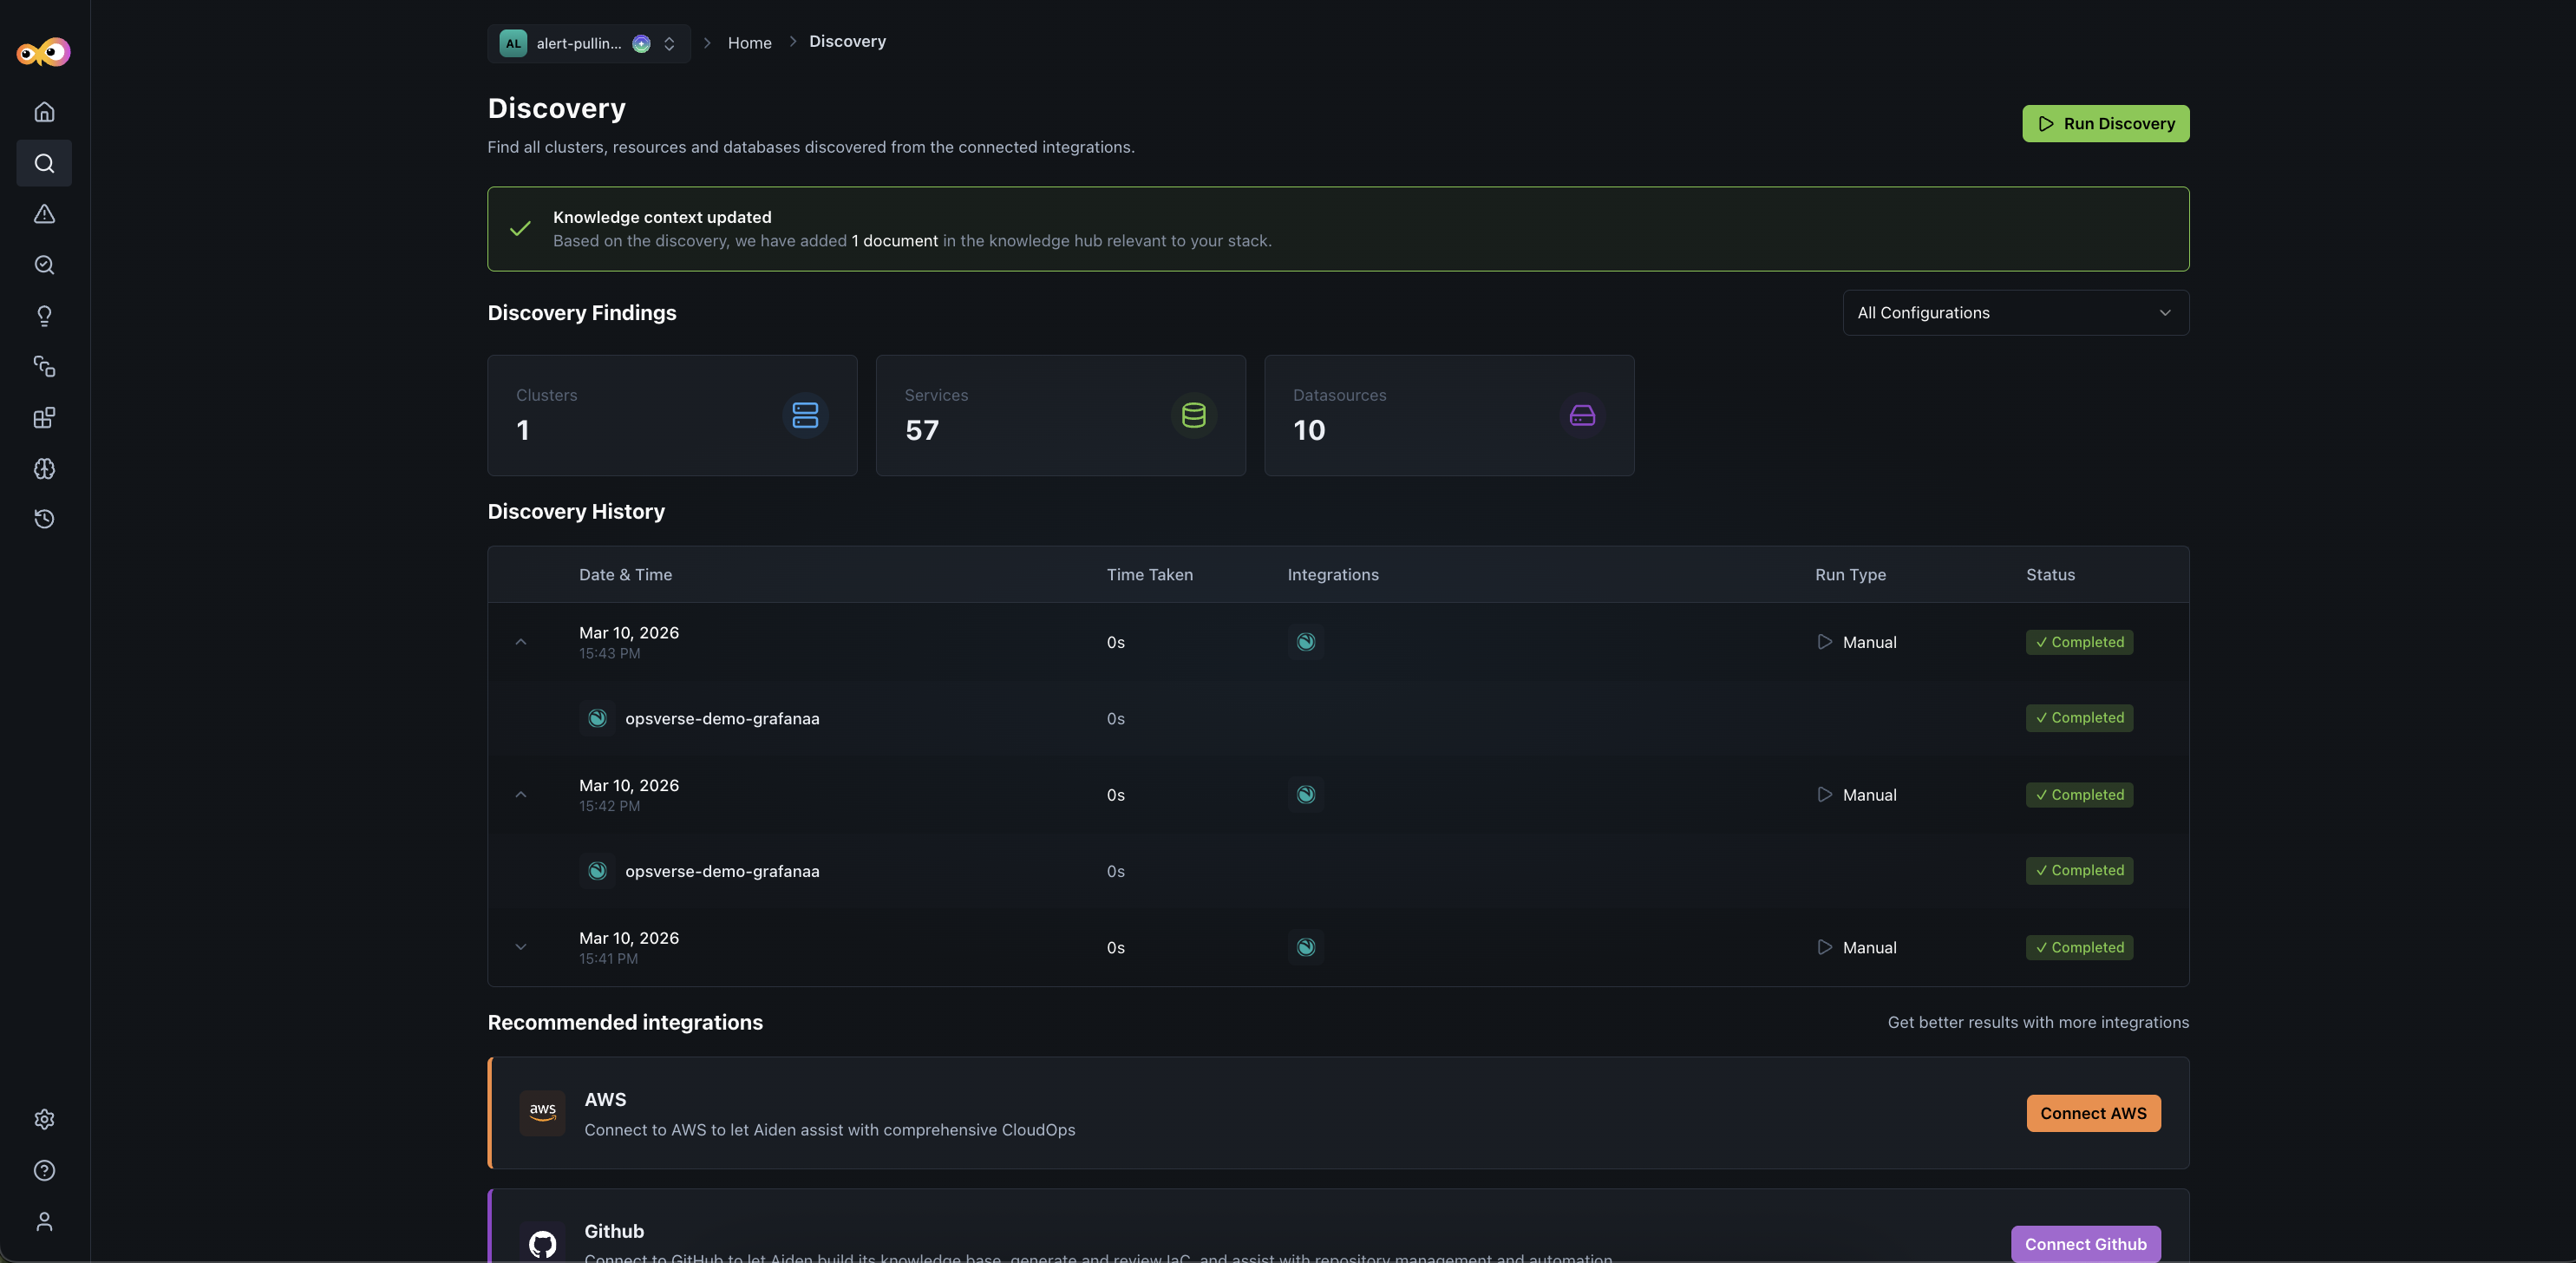
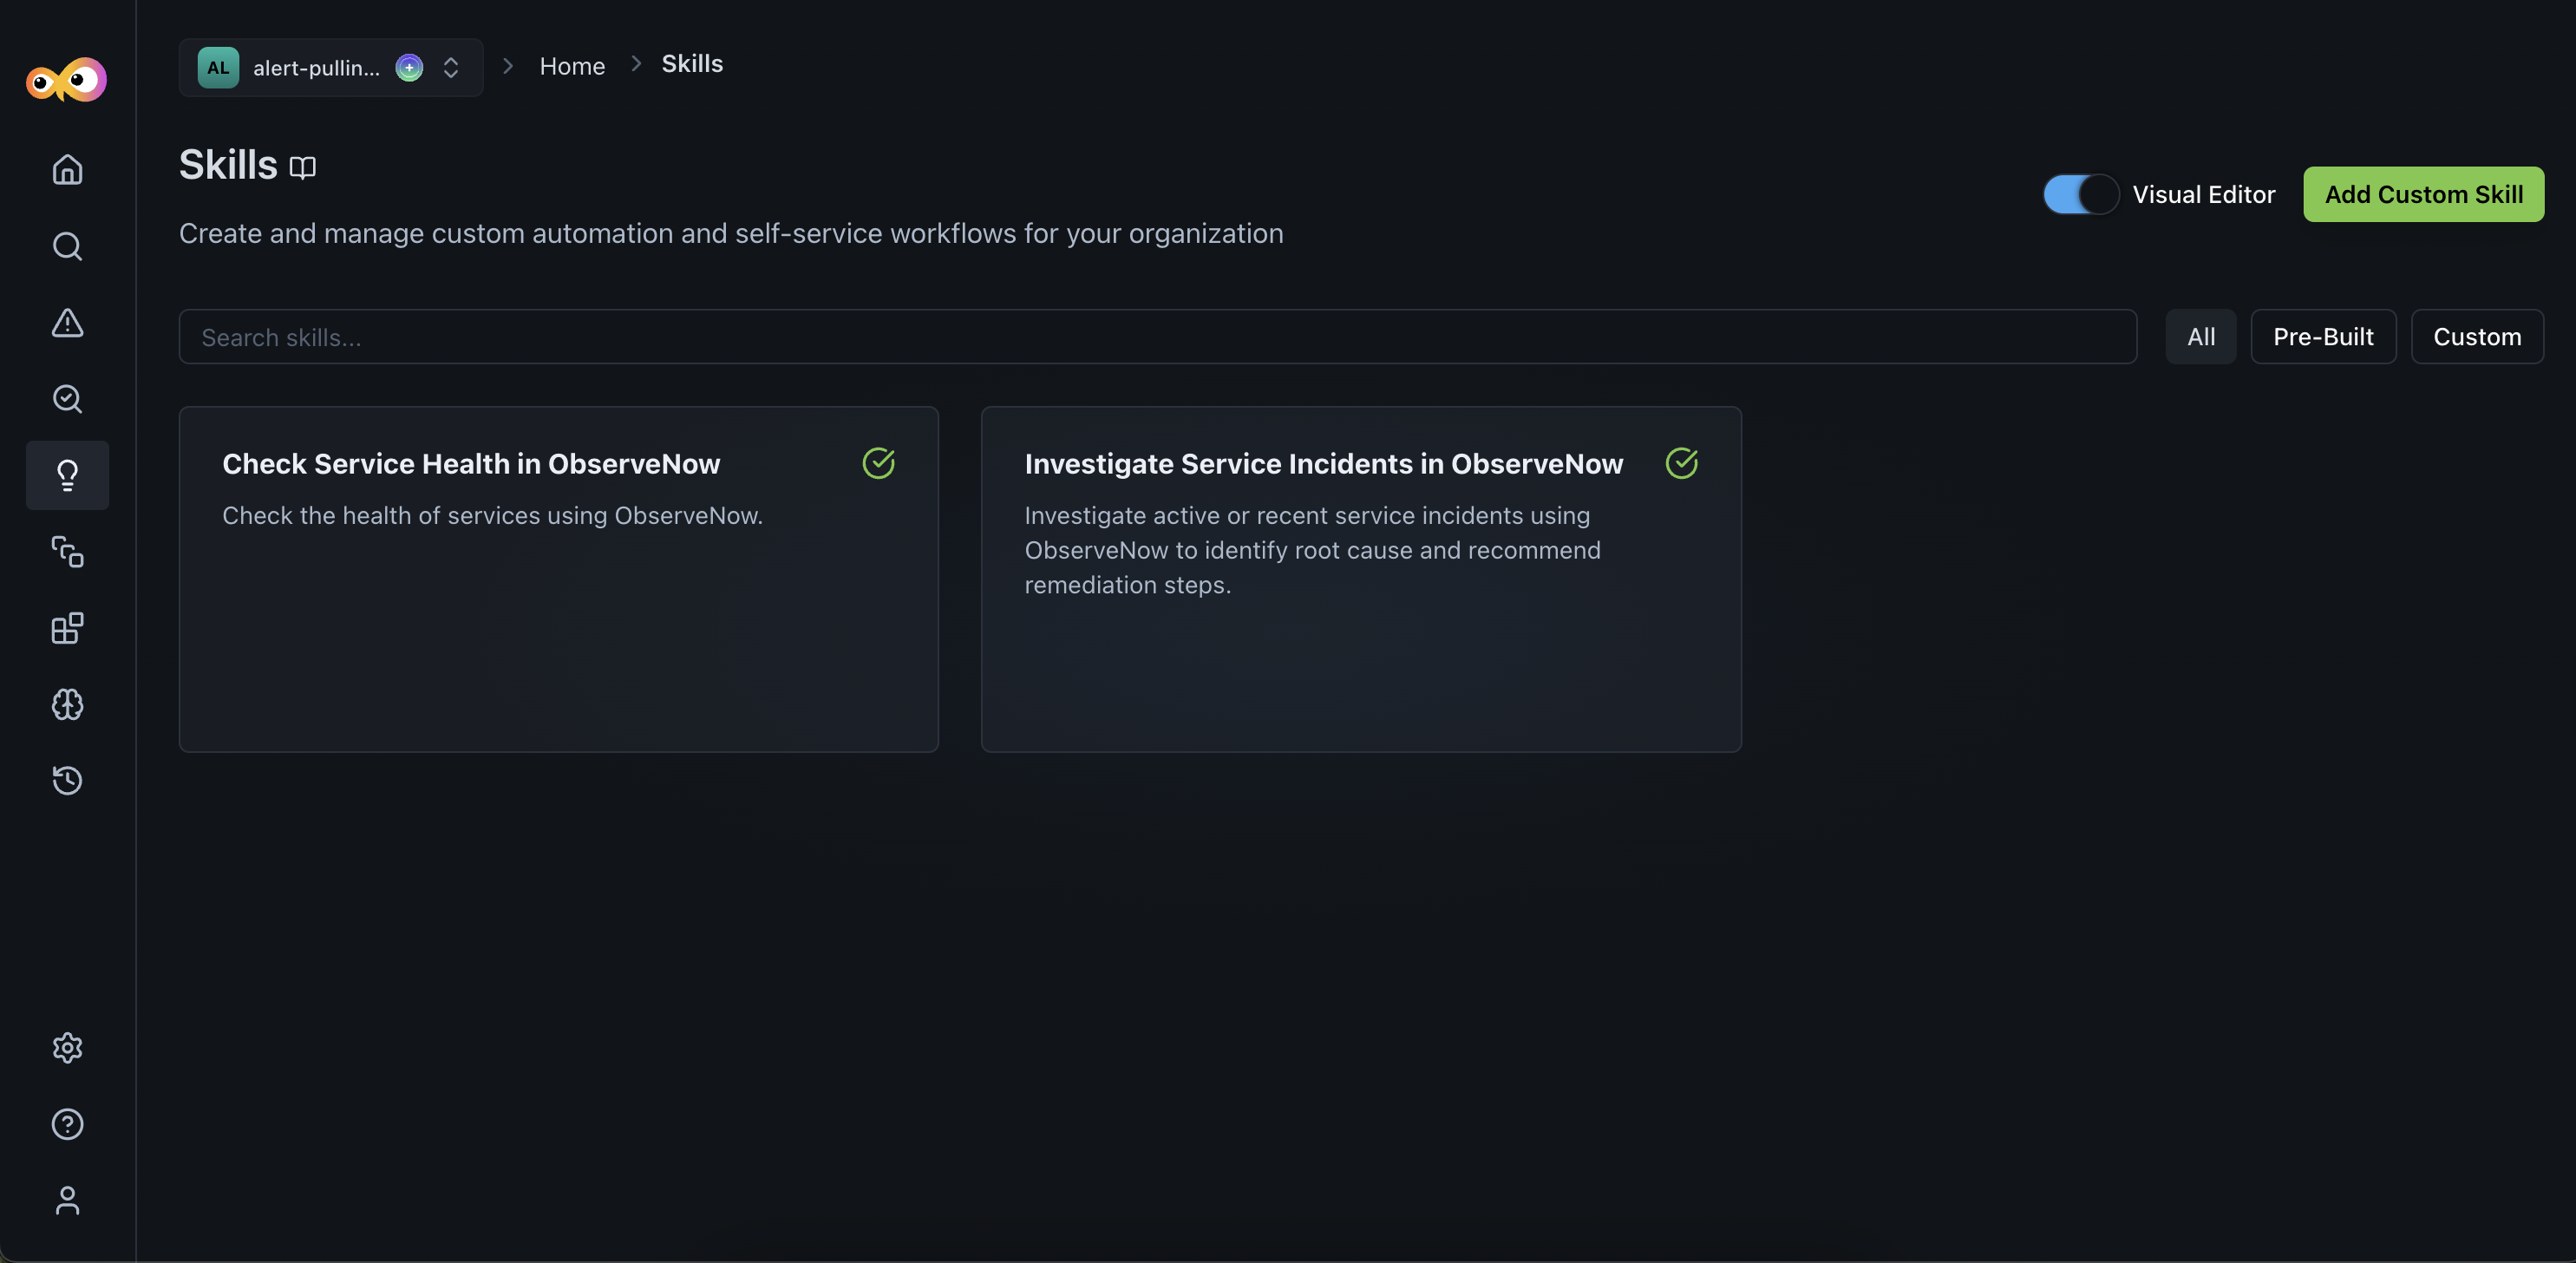
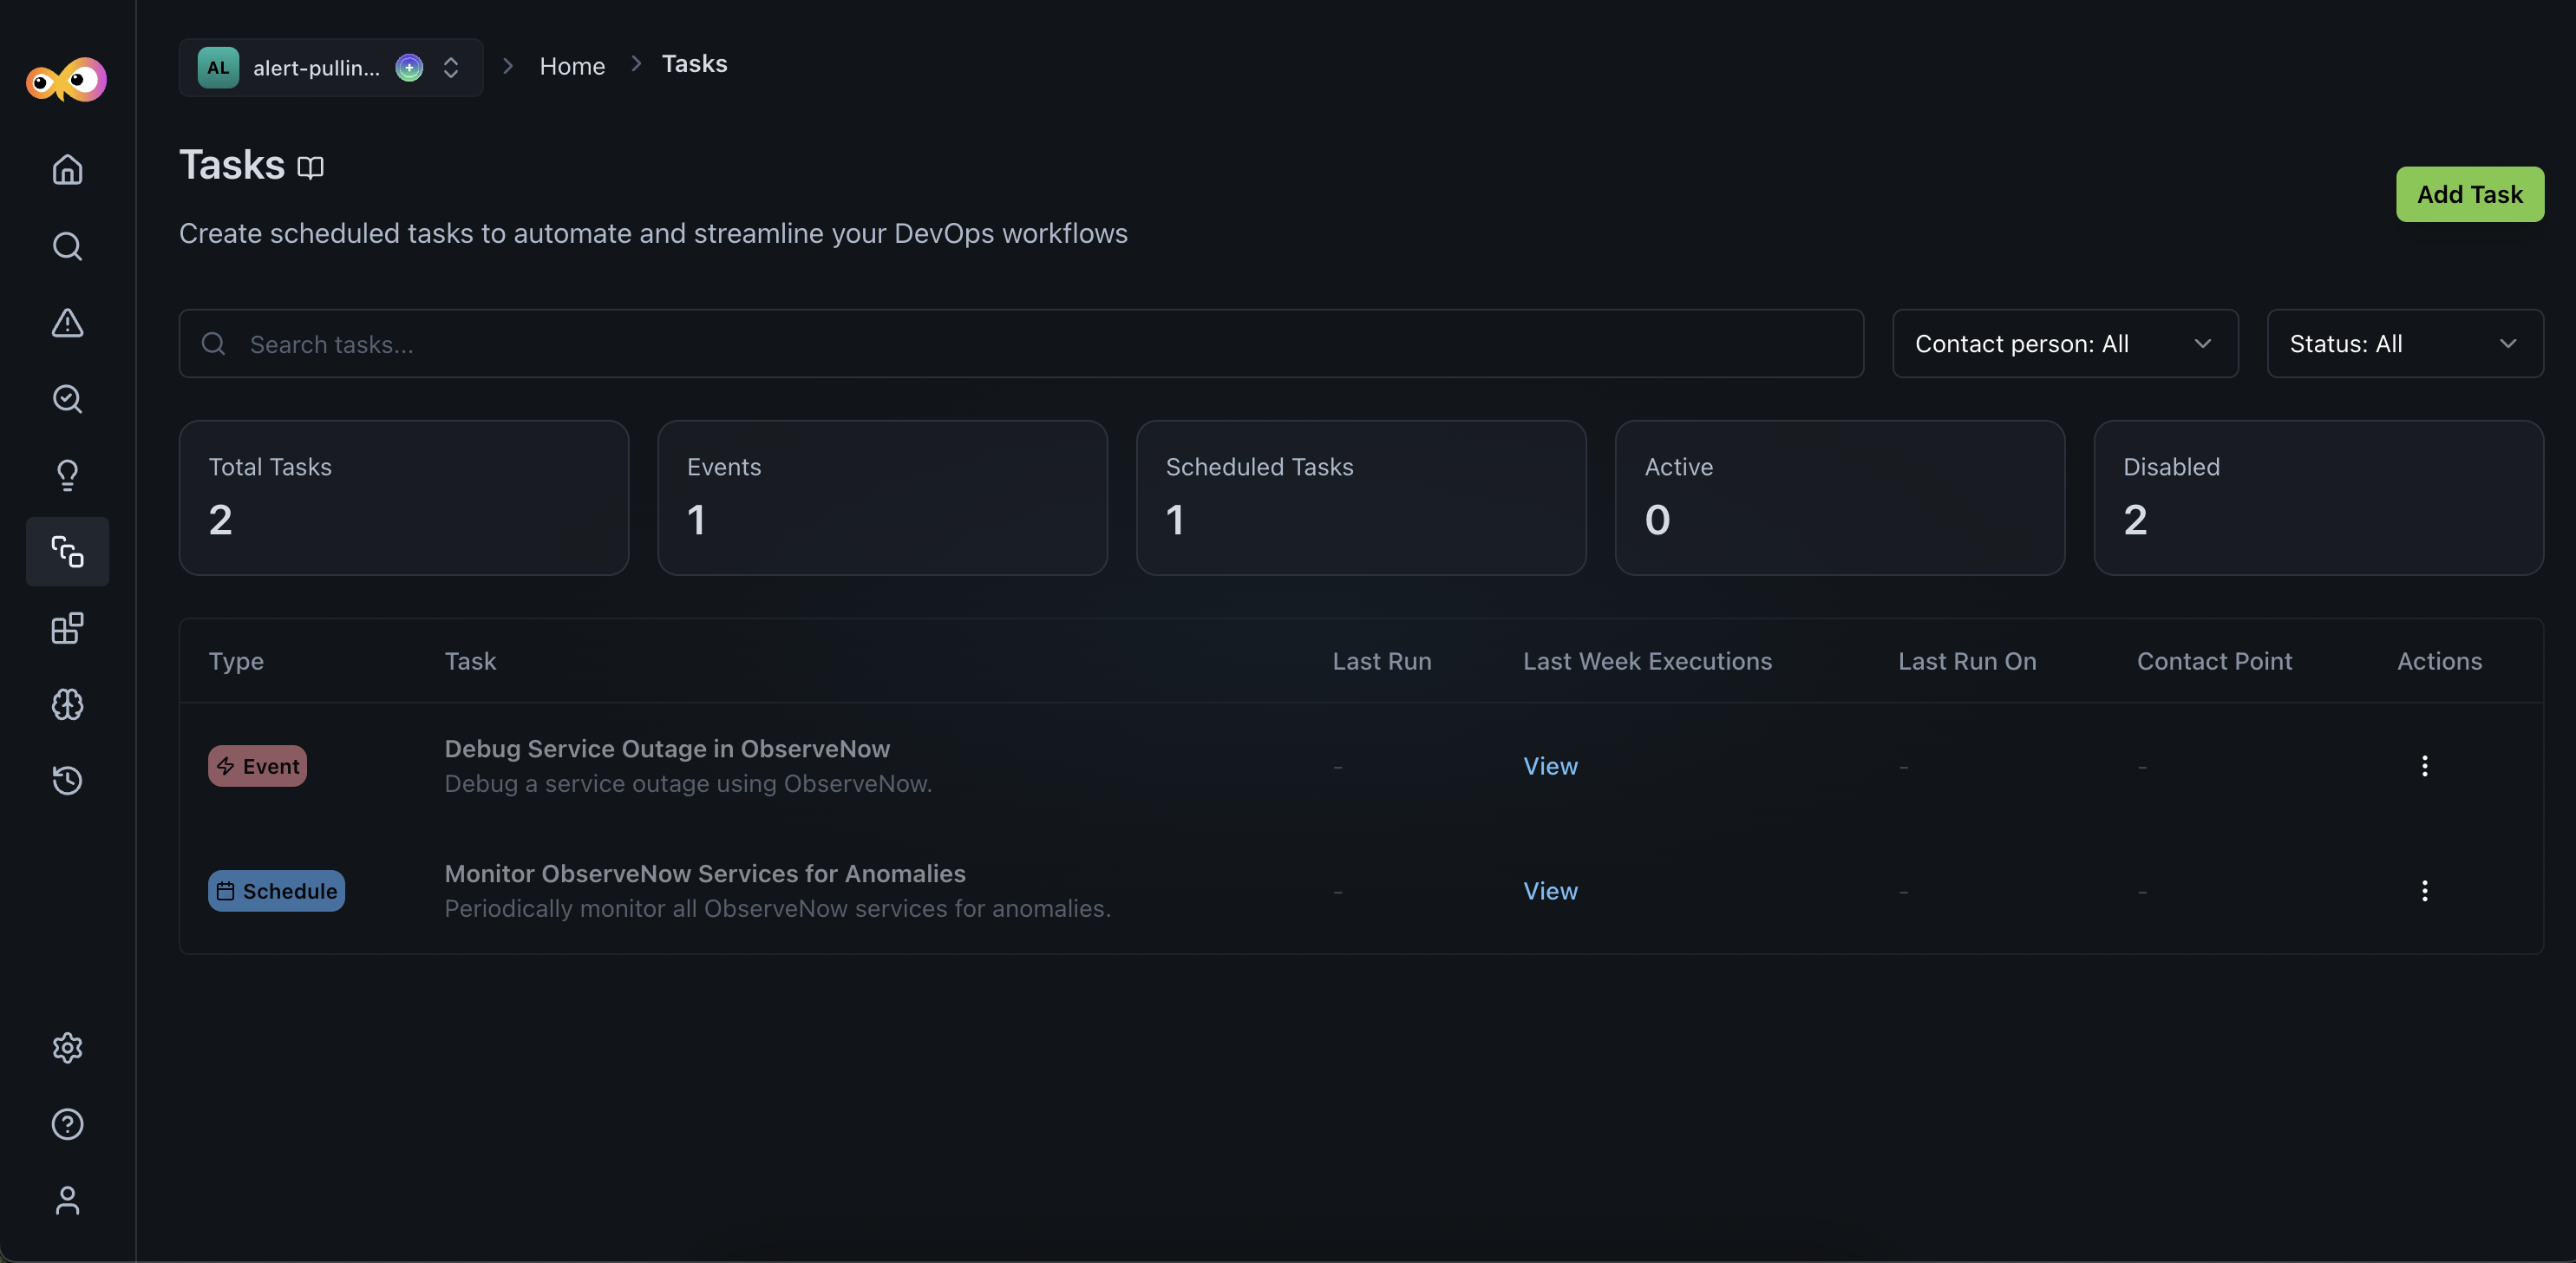
As part of the discovery process, Aiden creates a Knowledge Base, along with ready-to-use tasks and skills, so you can move from insight to action without extra setup. Aiden sets up tasks and skills for the resources it finds using built-in templates, eliminating the need for manual configuration.
- Prebuilt skills are generated automatically from discovery: Get started quickly with ready-to-use skills for:
- Monitoring service health
- Investigating incidents
- New incident-response tasks are automatically created:
- Debug Service Outage: runs when an issue is detected
- Monitor Services for Anomalies: runs every hour
- Optional notification setup: You can automatically link tasks to notification channels, so the right people are alerted when something needs attention.
- Updated Discovery Flow
- Tasks and skills are now created automatically.
- Tasks are created in a disabled state, so you can review them before enabling.
- Discovery results now include more context, like schedules, run times, and creators.
Why It Matters
You no longer need to manually set things up after discovery. Aiden prepares everything for you, so you can focus on reviewing, enabling, and taking action when you're ready.
What's Enhanced
Interactive Chat Experience Enhancements
Click to view
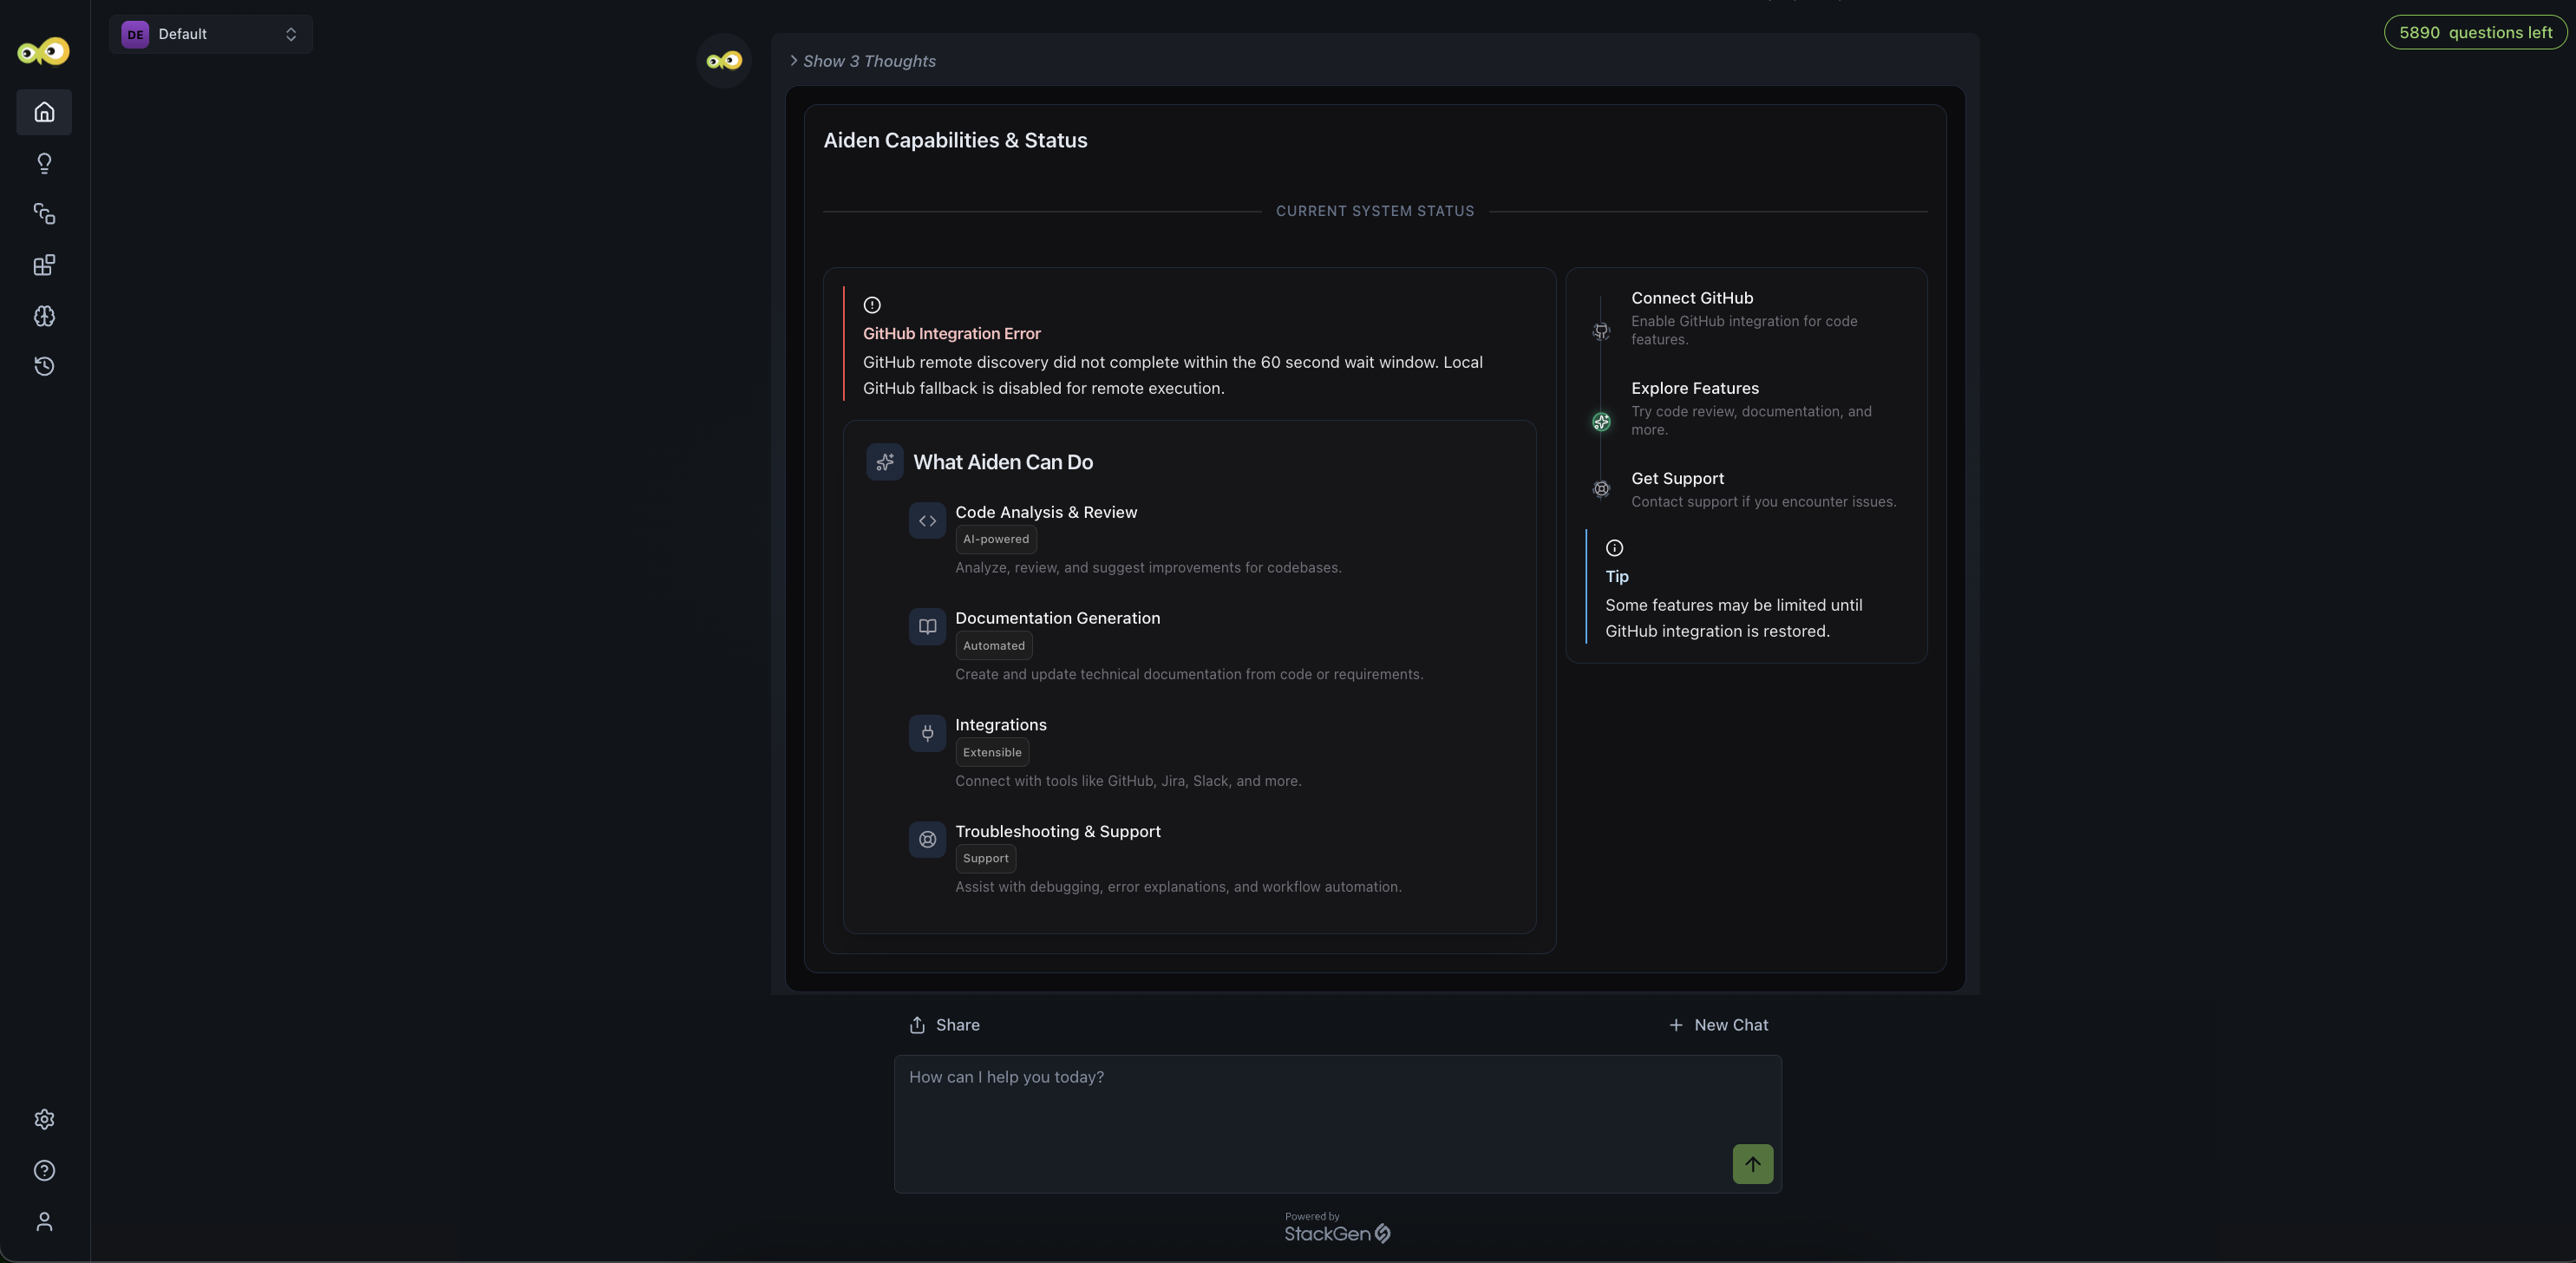
Chat now supports rich, interactive elements such as cards, tables, charts, tabs, and forms, making it easier to explore information and take action directly within conversations.
Why It Matters
You can scan structured answers and complete lightweight actions in the thread instead of parsing plain text only, which speeds up triage and follow-up when you work with Aiden.
What's Fixed
Kubernetes Subagent Runs Unnecessary Pod Checks
Click to view
We have fixed an issue where the Kubernetes subagent executed kubectl get pods -n default as a mandatory first step, even when your query did not require pod-level inspection.
Previously, the system prompt enforced a rigid investigation flow, so the subagent ran pod checks for unrelated queries such as node storage, CPU usage, services, or ingress details. That produced unnecessary commands, slower responses, and reduced efficiency. The subagent no longer treats that pod listing as a required first step when your question does not need it.