StackGen ObserveNow
StackGen ObserveNow
StackGen ObserveNow is an OSS-based full-stack observability solution that brings together tools like Grafana, Prometheus, Loki, Jaeger, OpenTelemetry, etc. into a unified observability experience.
Connect Aiden with your StackGen ObserveNow platform to get intelligent insights from your observability stack through a unified interface. Once enabled, Aiden can leverage your Grafana data sources to analyze metrics, logs, traces, APM, and other observability data through natural language conversations.
Integration Capabilities
With StackGen ObserveNow integration, Aiden can:
- Access and analyze metrics from Prometheus data sources.
- Query and investigate logs from Loki data sources.
- Analyze application health by querying trace data sources.
- Compare metric trends across different time periods.
- Perform detailed root cause analysis (RCA).
- Analyze firing alerts.
- Correlate logs and metrics to help troubleshoot issues.
- Investigate performance bottlenecks and anomalies.
- Analyze resource utilization patterns.
- Generate insights from your observability data.
Supported Datasources
The Grafana integration currently supports accessing the following data sources:
- Prometheus: For all metrics data.
- Loki: For all logging data.
- Read Grafana-based alerts.
- Read the list of Grafana dashboards.
Additional support for data sources will be added in future updates.
Create Custom Skills
On top of the several out of the box capabilities, you can create custom skills to add additional capabilities. Here are some examples:
- Create automated health checks based on Grafana data sources
- Set up cross-datasource correlation for complex troubleshooting
- Develop custom anomaly detection for specific services
Check out the Skills page for more information.
Enable StackGen ObserveNow Integration
Generate your Grafana API Key
- You need to be an Admin in Grafana.
- Security Best Practices:
- Create a dedicated API key for Aiden with minimum required permissions.
- Use the minimal role required for Explore in your Grafana:
Viewer(if Explore is enabled for viewers) orEditorotherwise. - Follow least-privilege; upgrade temporarily when needed and rotate regularly.
- Regularly rotate API keys (every 60-90 days recommended).
- Ensure your Grafana API key has appropriate permissions for the data sources you want Aiden to access. For using Prometheus and Loki data sources, the API key needs at least
Editorrole for these data sources.
-
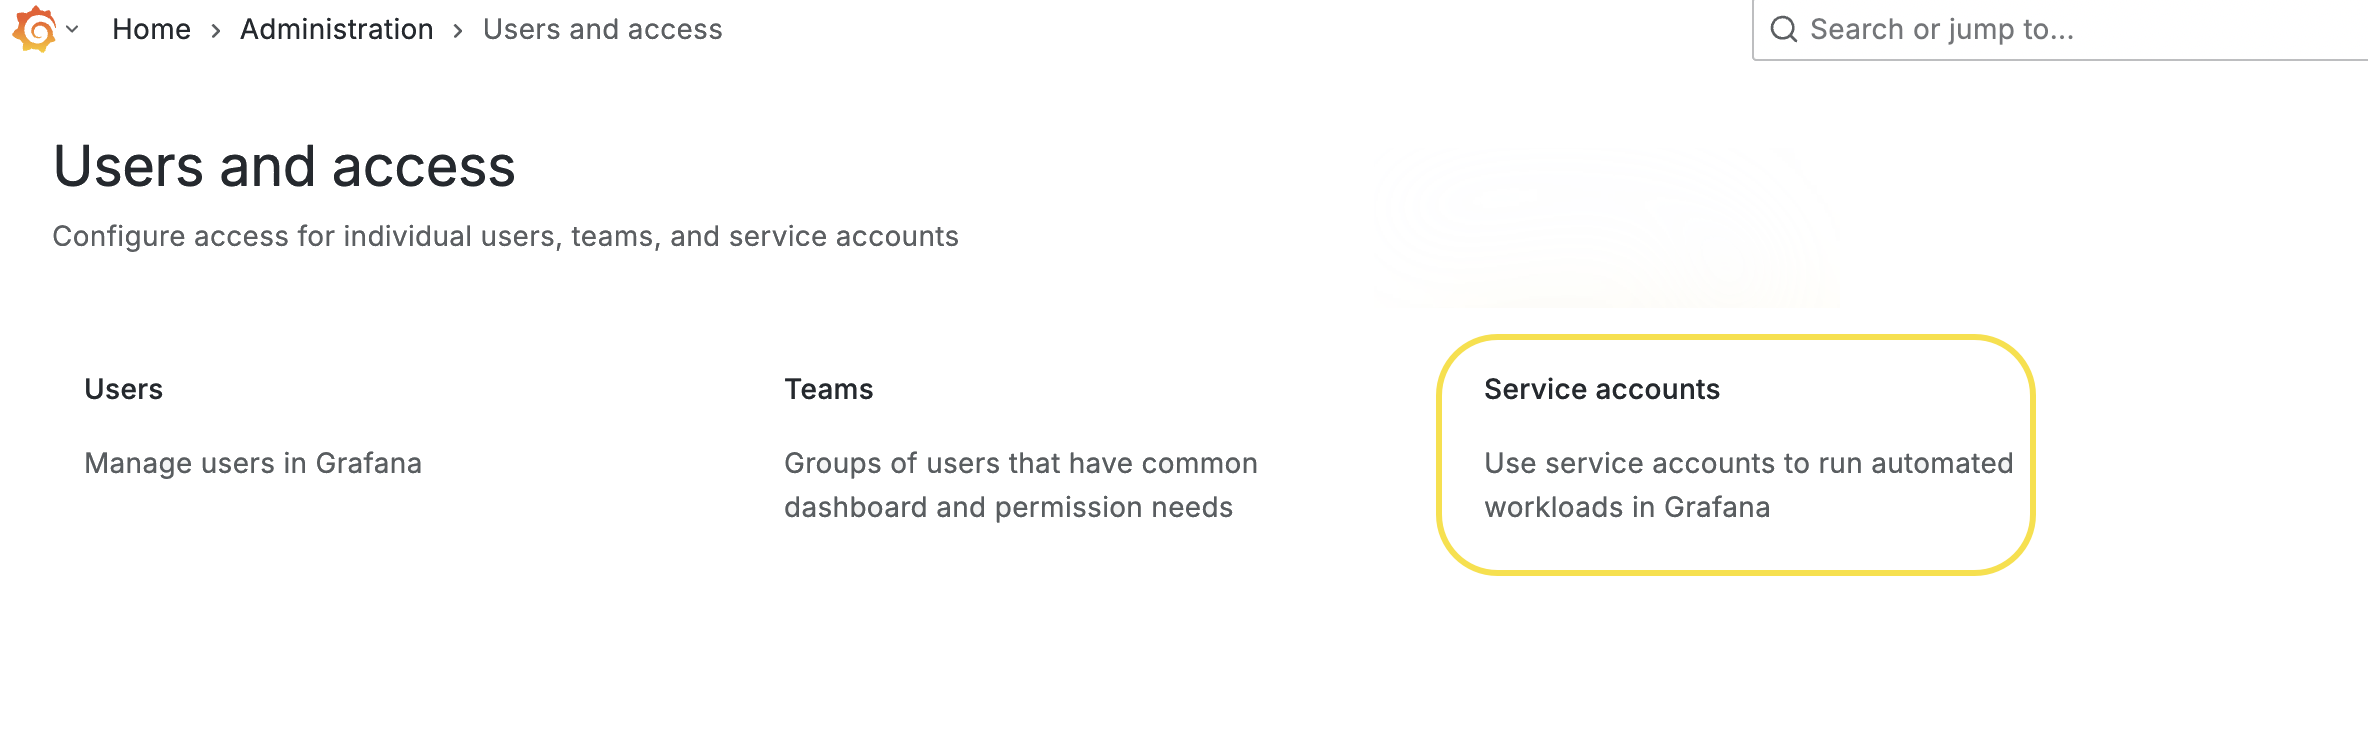
Navigate to Administration > Users and access > Service accounts.
-
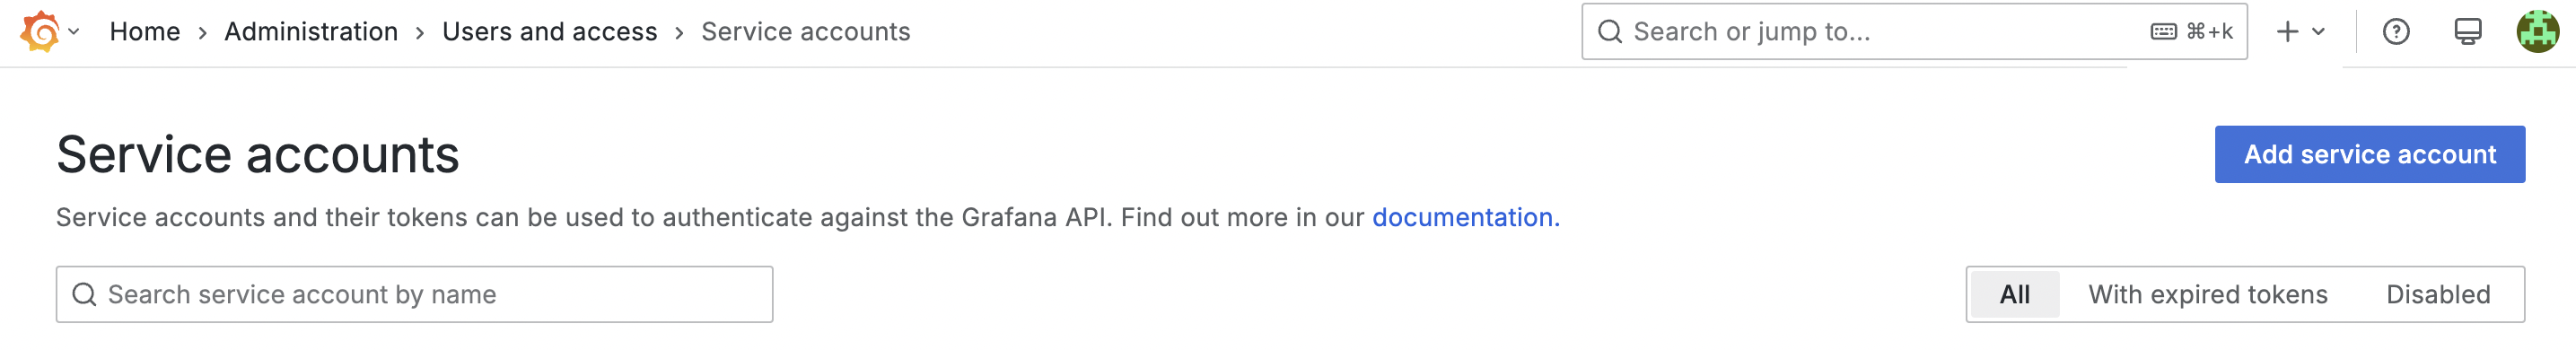
Click the Add Service Account button and follow the on-screen instructions to create a Service Account.
-
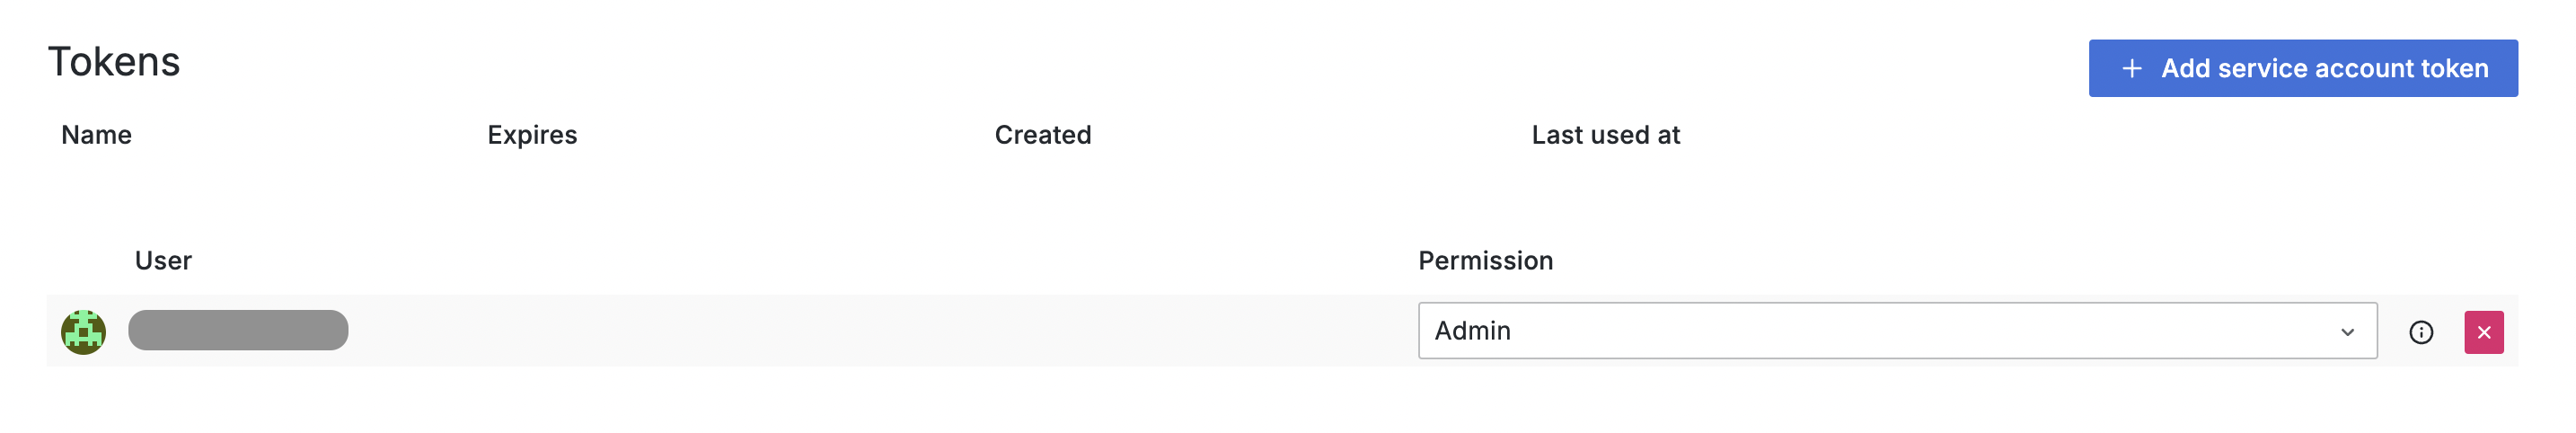
Create a Service Account Token by clicking the Add Service Account Token button and follow the on-screen instructions:
Steps to Enable StackGen ObserveNow Integration
Follow these steps to enable the Integration:
-
From the Aiden home page, click Integrations from the navigation panel to the left.
-
Hover and click the Activate button on the StackGen ObserveNow Integration card.
-
Enter the integration configuration parameters:

- Grafana URL: This is the web address (endpoint) of your Grafana server. It tells Aiden where to send API requests for dashboards, panels, alerts, and metrics.
- If Grafana is self-hosted, you can find this in your deployment or ingress configuration.
- If you’re using Grafana Cloud, the URL will look like:
https://<your-stack>.grafana.net. - Check out HTTP API Overview.
- API Token: This is the authentication token Aiden uses to access the Grafana API securely.
- You can create one by navigating to Grafana > ⚙️ Settings > API Keys > New API Key.
- Choose an appropriate role and permissions:
- Viewer: Read-only access (typically sufficient; ensure Explore is enabled for viewers).
- Editor: Modify dashboards.
- Admin: Full control (use sparingly).
- Grafana URL: This is the web address (endpoint) of your Grafana server. It tells Aiden where to send API requests for dashboards, panels, alerts, and metrics.
-
Click Save to enable the integration.
Sample Prompts
Here are a few sample prompts that you can use:
- Show me CPU usage trends for the payment service over the last 24 hours.
- What error logs correlate with the latency spike at 3 PM yesterday?
- Compare memory usage between production and staging environments.
- Are there any services showing abnormal error rates?
- Find all error logs from the authentication service during the last incident.
- Which services have the highest request latency right now?
- Create a report of resource utilization trends for all production services.
- Tech store orders are failing. Find out why.
- Analyze the resource usage of pods in production and provide recommendations for right-sizing.
Limitations
- The StackGen ObserveNow integration currently supports read-only operations.
- It does not support operations like creating alert rules, dashboards, etc.