Investigations
Investigations
The Investigations page tracks all investigations you've started via the Alerts page. It is scoped to your workspace and visible only to members with access. You can view and monitor open investigations, review completed findings, continue conversations with Aiden, and mark incidents as resolved.
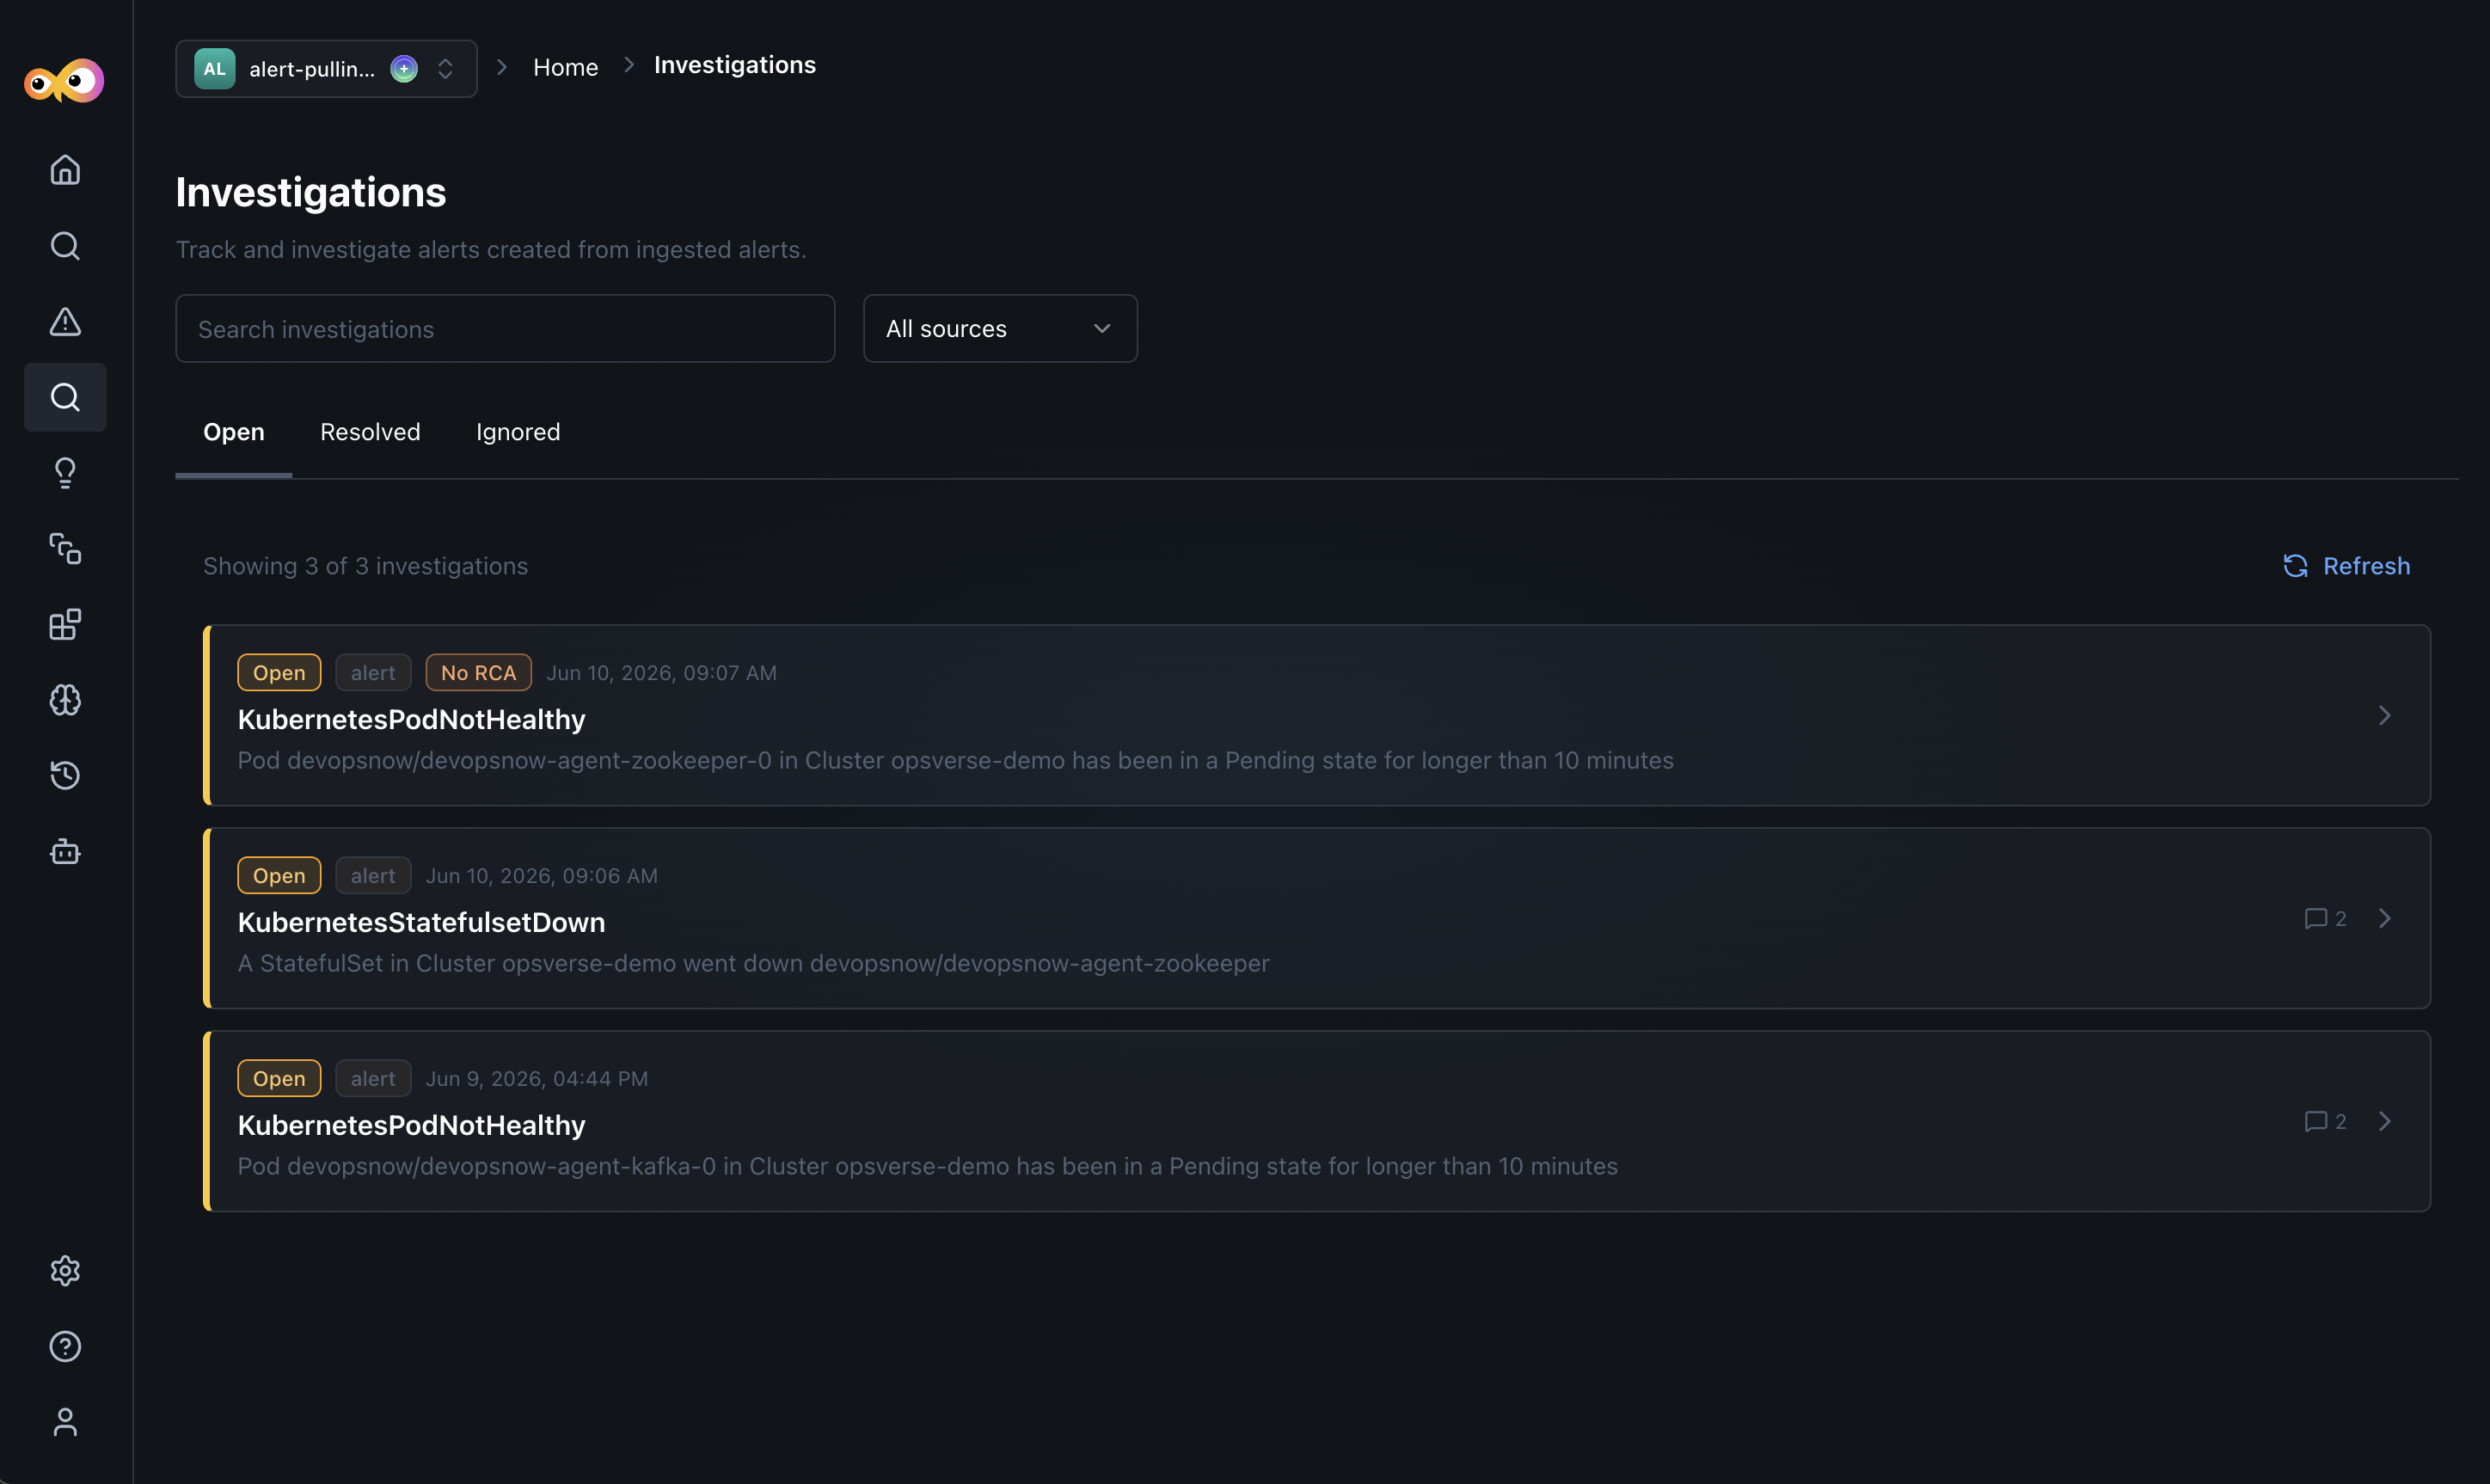
Each investigation lists:
- Status: Whether the investigation is Open, Resolved, or Ignored.
- Source: The type of event that triggered it (e.g.,
alert). - RCA status: A No RCA badge indicates the investigation was created but Aiden has not yet run a root cause analysis.
- Alert name and description: The name of the originating alert and a short summary of what was detected.
- Timestamp: When the investigation was created.
- Conversation count: If Aiden has had follow-up conversations on the investigation, a chat icon shows the count.
From the investigations page, you can also:
- Use the Search bar to find investigations by name.
- Click All sources dropdown to filter investigations by integration.
- Click Open, Resolved, and Ignored tabs to switch between investigation states.
- Click Refresh to pull the latest updates.
Investigation Details
Clicking any investigation opens its detail page.
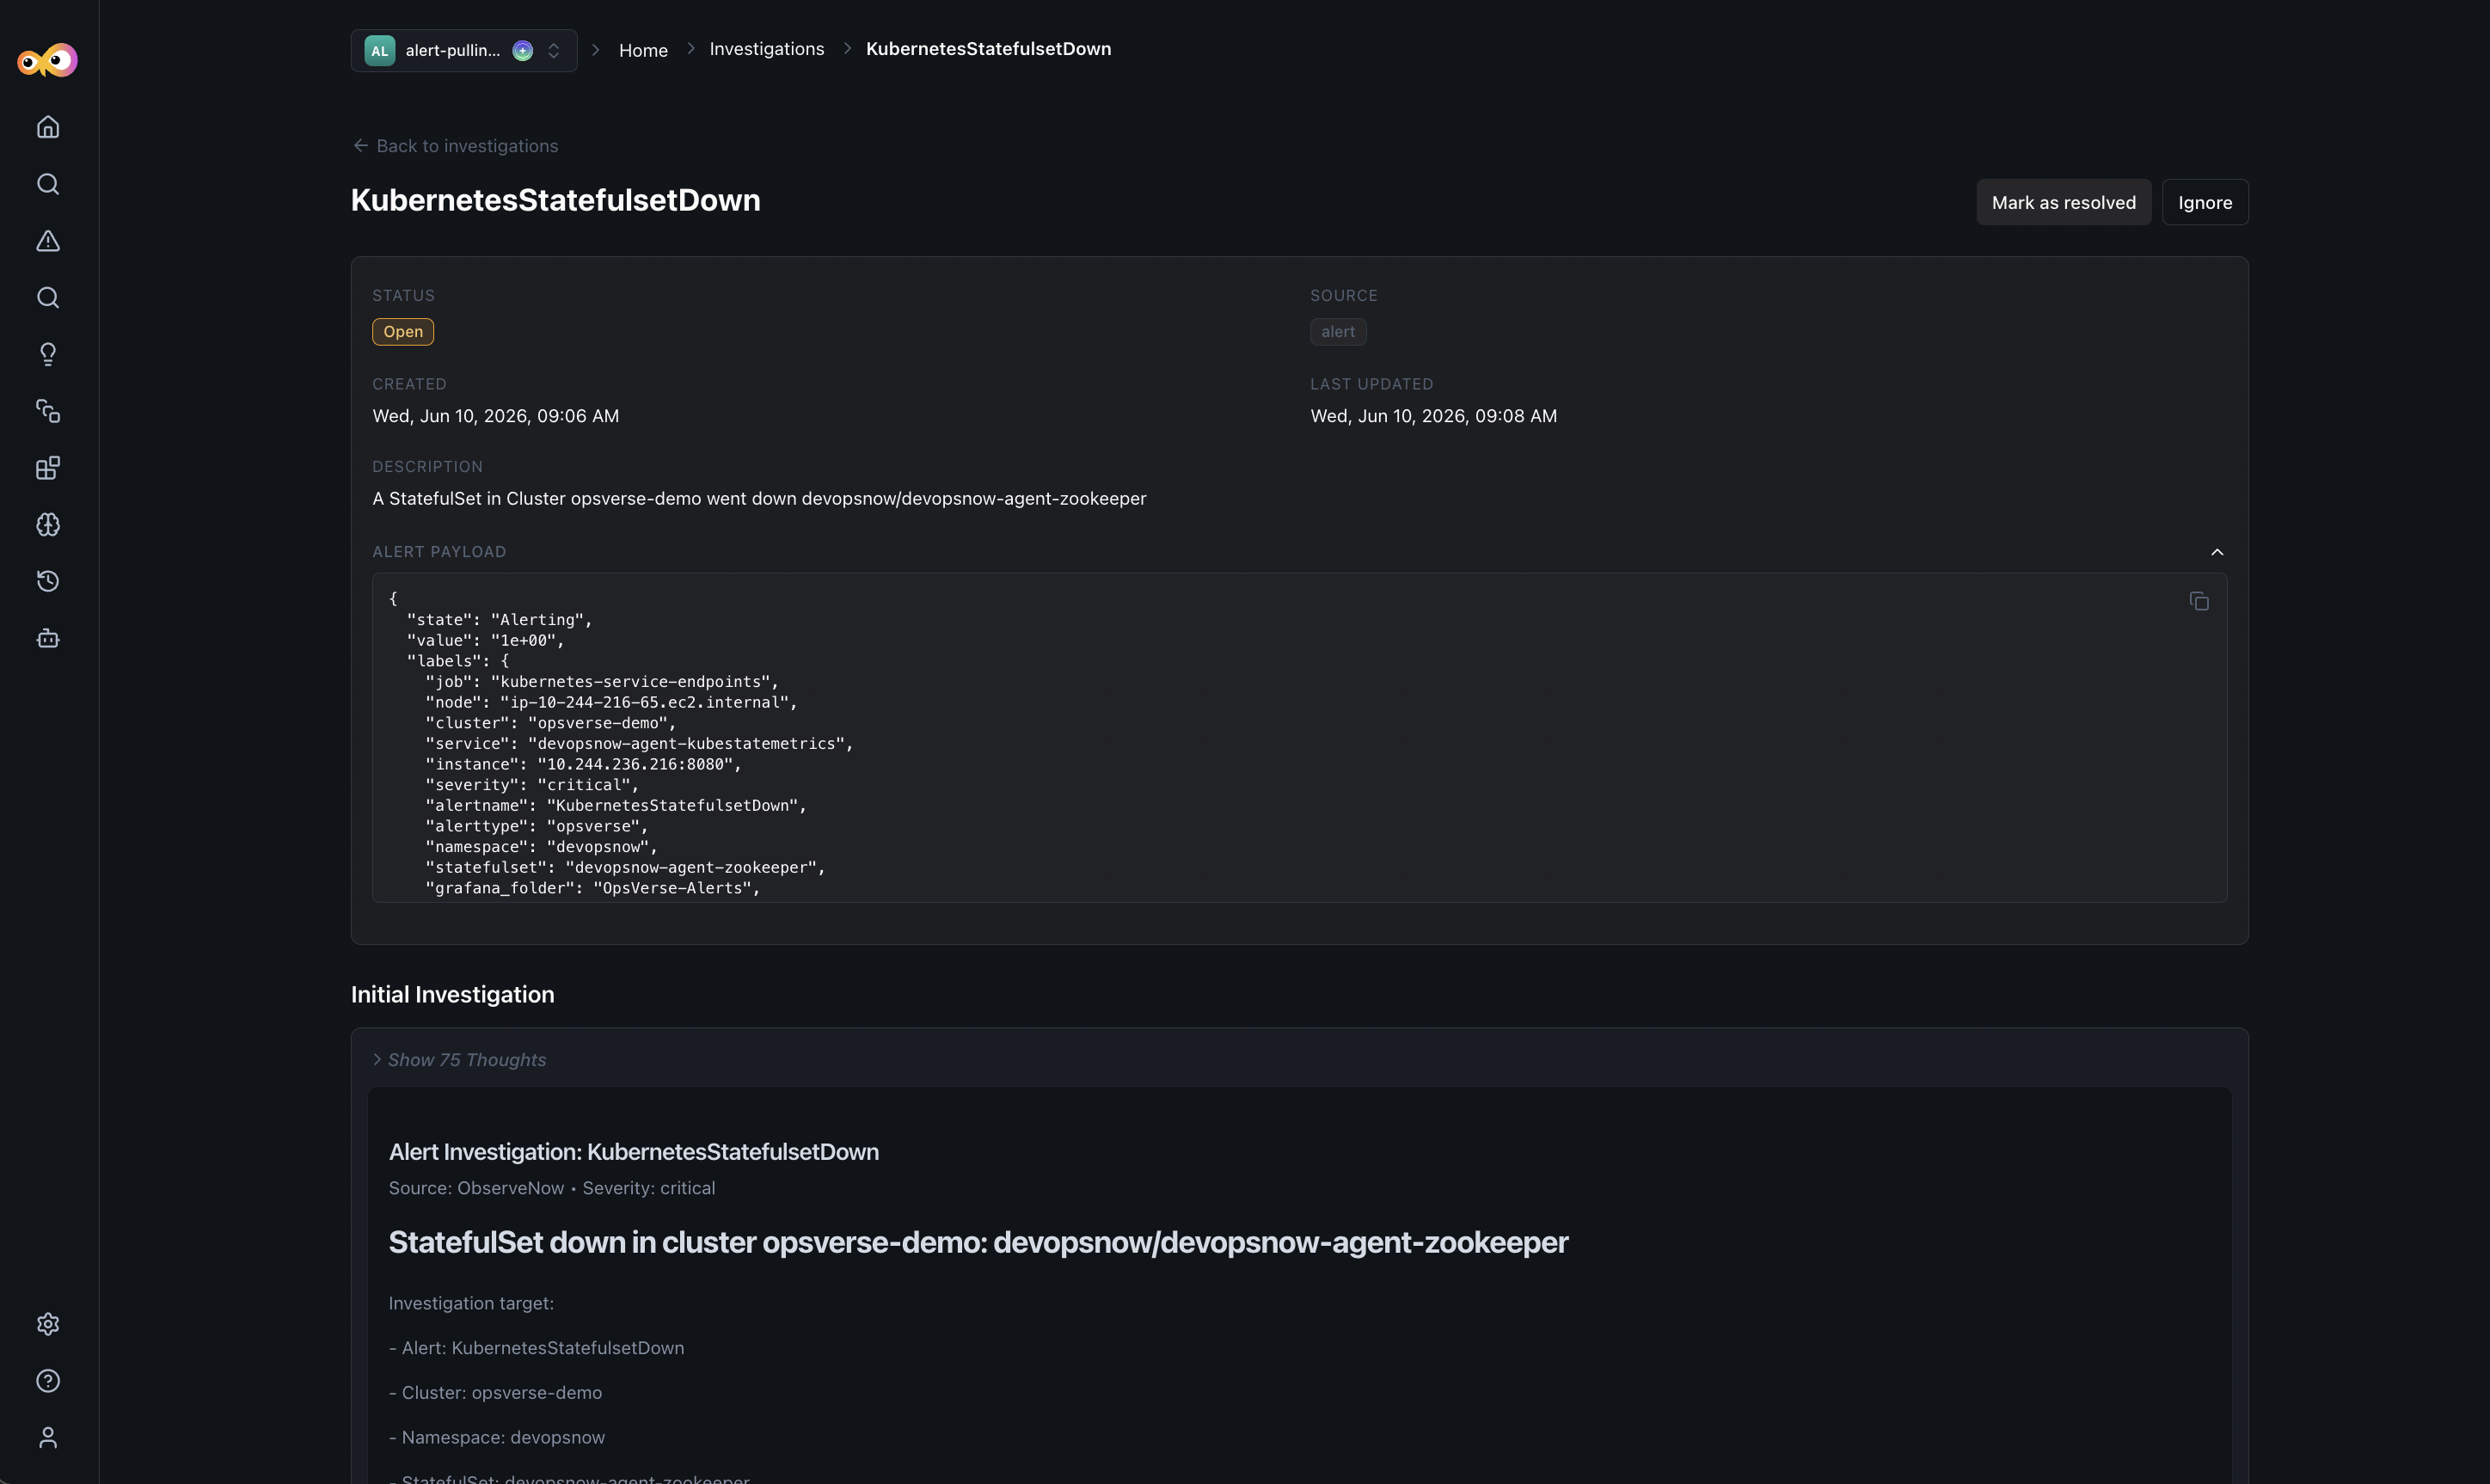
You will see the following investigation metadata:
- Status: Current state of the investigation
Open,Resolved, orIgnored. - Source: Where the alert originated (e.g.,
alert). - Created and Last Updated timestamps for when the investigation was opened and last modified.
- Description: The full alert description from the source integration.
- Alert Payload: Expand this section to see the raw event payload sent by the integration, including labels, cluster details, severity, namespace, and the source URL.
- Use Mark as resolved or Ignore button once the issue is addressed.
If no investigation has been run yet, the Initial Investigation section shows a prompt to Start Investigation. Aiden will analyze the alert payload, query your connected data sources (Prometheus, Loki, Jaeger, etc.), and produce a structured root cause report.
The specific content of the investigation report will depend on the alert, the context, and the integration involved. Generally, the report may include:
- Investigation target: A summary of the affected resource such as cluster, namespace, StatefulSet, pod, or alert UID.
- Datasource discovery: Which data sources Aiden queried during the investigation (for example, Prometheus, Loki, Jaeger, or ClickHouse), depending on what is available and relevant for your configuration.
- Root cause summary: An explanation of what went wrong and why, based on correlated findings across the data sources involved.
- Recommended remediation steps: A prioritized checklist of actions tailored to the incident and your environment. This may contain specific commands or checks to execute.
- Evidence summary: Key signals or evidence supporting the report, such as replica counts, pod phases, waiting reasons, or other relevant metrics—these details will vary by investigation and integration.
- At the bottom of the investigation report, Aiden adds two additional sections:
- Useful links: Context-aware links to relevant dashboards, logs, traces, or metrics views, generated when available for your integrations.
- Actions performed: A summarized record of the key investigation steps Aiden executed to produce the findings.
New Conversation
Each investigation includes a New Conversation button so you can continue working with Aiden after the initial report. Use it to ask follow-up questions, request deeper analysis, or get help with remediation steps. Aiden retains investigation context, including the alert payload, findings, and completed actions, so you can continue in plain language without repeating incident details.
The conversation count shown in the investigations list reflects how many conversations have taken place on that investigation.
Conversations require the initial investigation to be run first. If you've not run the initial investigation, the Conversations section will show a prompt to start one.
Additional Resources
- Alerts: Triage active alerts and configure ingestion
- Aiden SRE: Enable SRE mode for automatic investigation on every alert
- Integrations: Supported integrations for alert ingestion
- Knowledge Hub: How discovered data and investigation context are used