Alerts
Alerts
The Alerts page shows all active incidents and alerts from your connected integrations. It is scoped to your workspace and visible only to members with access. Use it to triage alerts by severity, start AI-powered investigations, review flagged alerts, and configure alert ingestion.
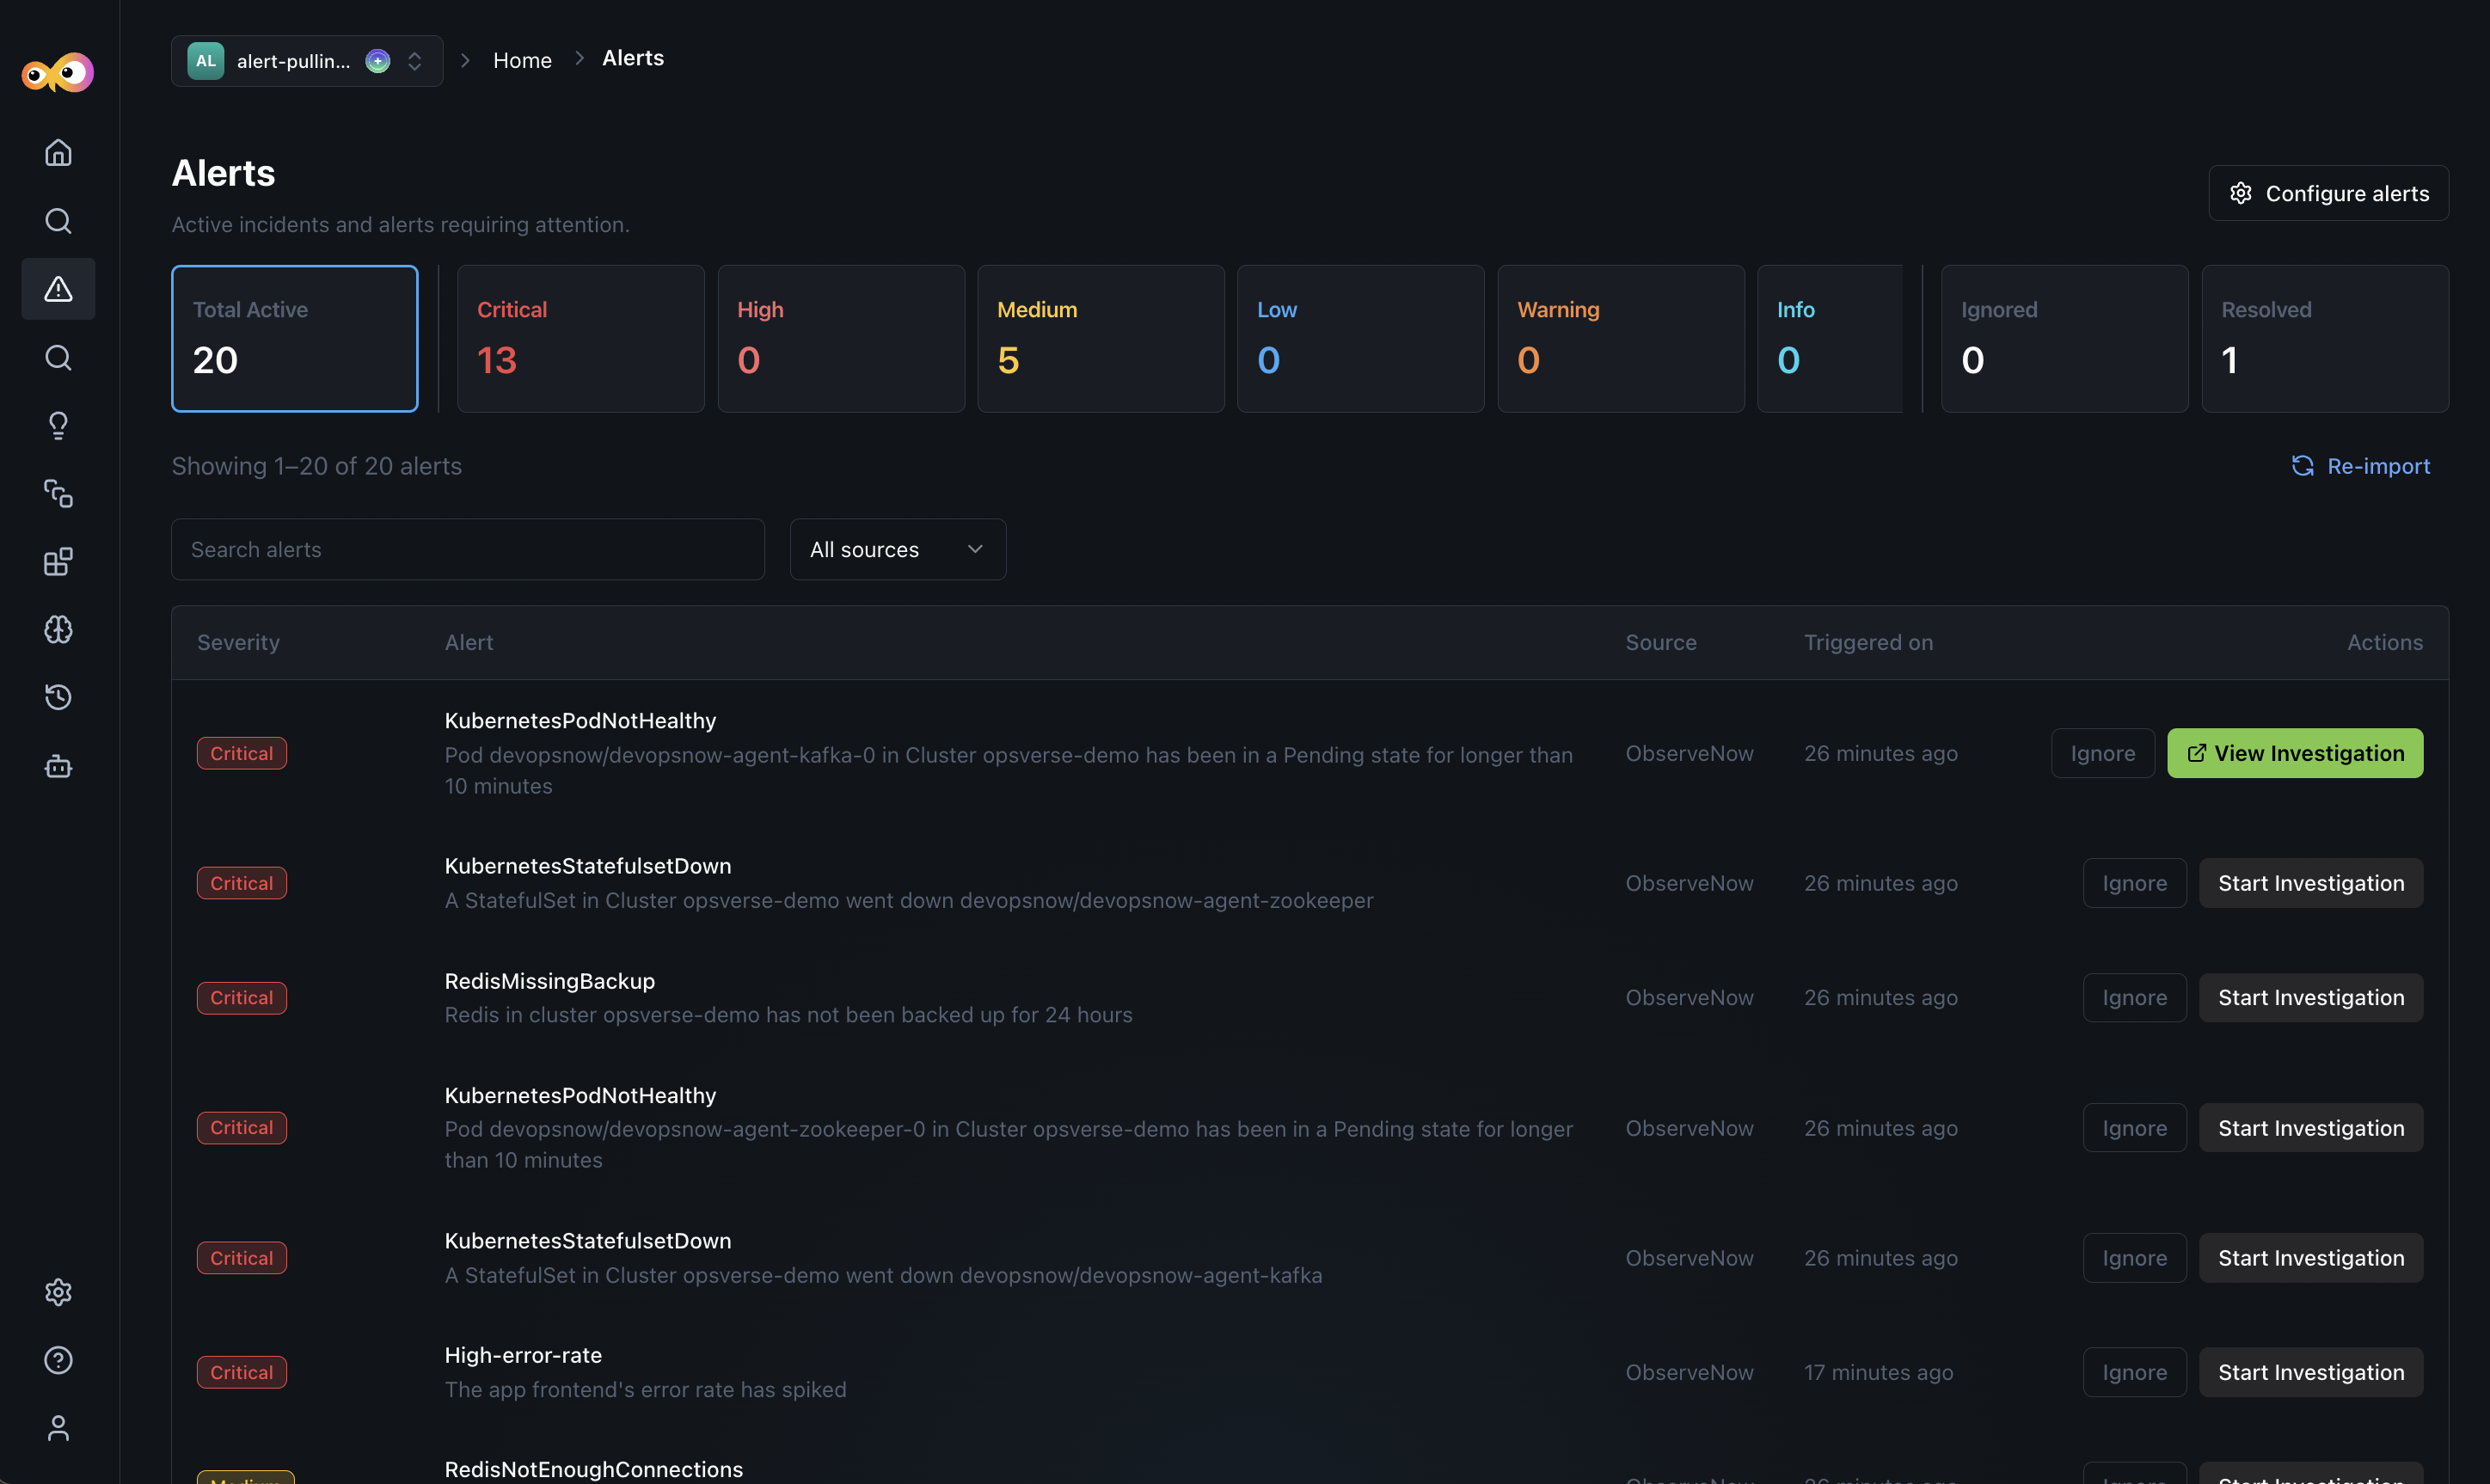
You can see the following Severity Summary on your Alerts page:
- Total Active: Currently open alerts.
- Critical: Immediate action required, service impact is likely.
- High: Significant risk, investigate within the hour.
- Medium: Degraded state, monitor and schedule a fix.
- Low: Minor issue, address in normal workflow.
- Warning: Approaching a threshold, watch closely.
- Ignored: Alerts you have removed from the monitoring list.
- Resolved: Alerts marked as resolved.
Click any tile to filter the alert list to that severity. Each alert shows its severity, the name and description describing what triggered it and the affected resource, the source integration (such as ObserveNow or Grafana), and how long ago it was triggered.
Additionally, you can:
- Use the Search bar to find alerts by name or description.
- Select the All sources dropdown to filter alerts by a specific integration.
- Click Re-import to manually pull the latest alerts from all connected sources.
- Click Ignore next to an alert to suppress the alert from the monitored list and move it to the Ignored list.
- Click Start Investigation to open an AI-powered root cause analysis for that alert.
Start an Investigation
Clicking Start Investigation next to an alert opens the investigation detail page.
The page shows the alert's Status, Source, Created and Last Updated timestamps, and a full Description. Expand Alert Payload to see the raw event data from the source integration.
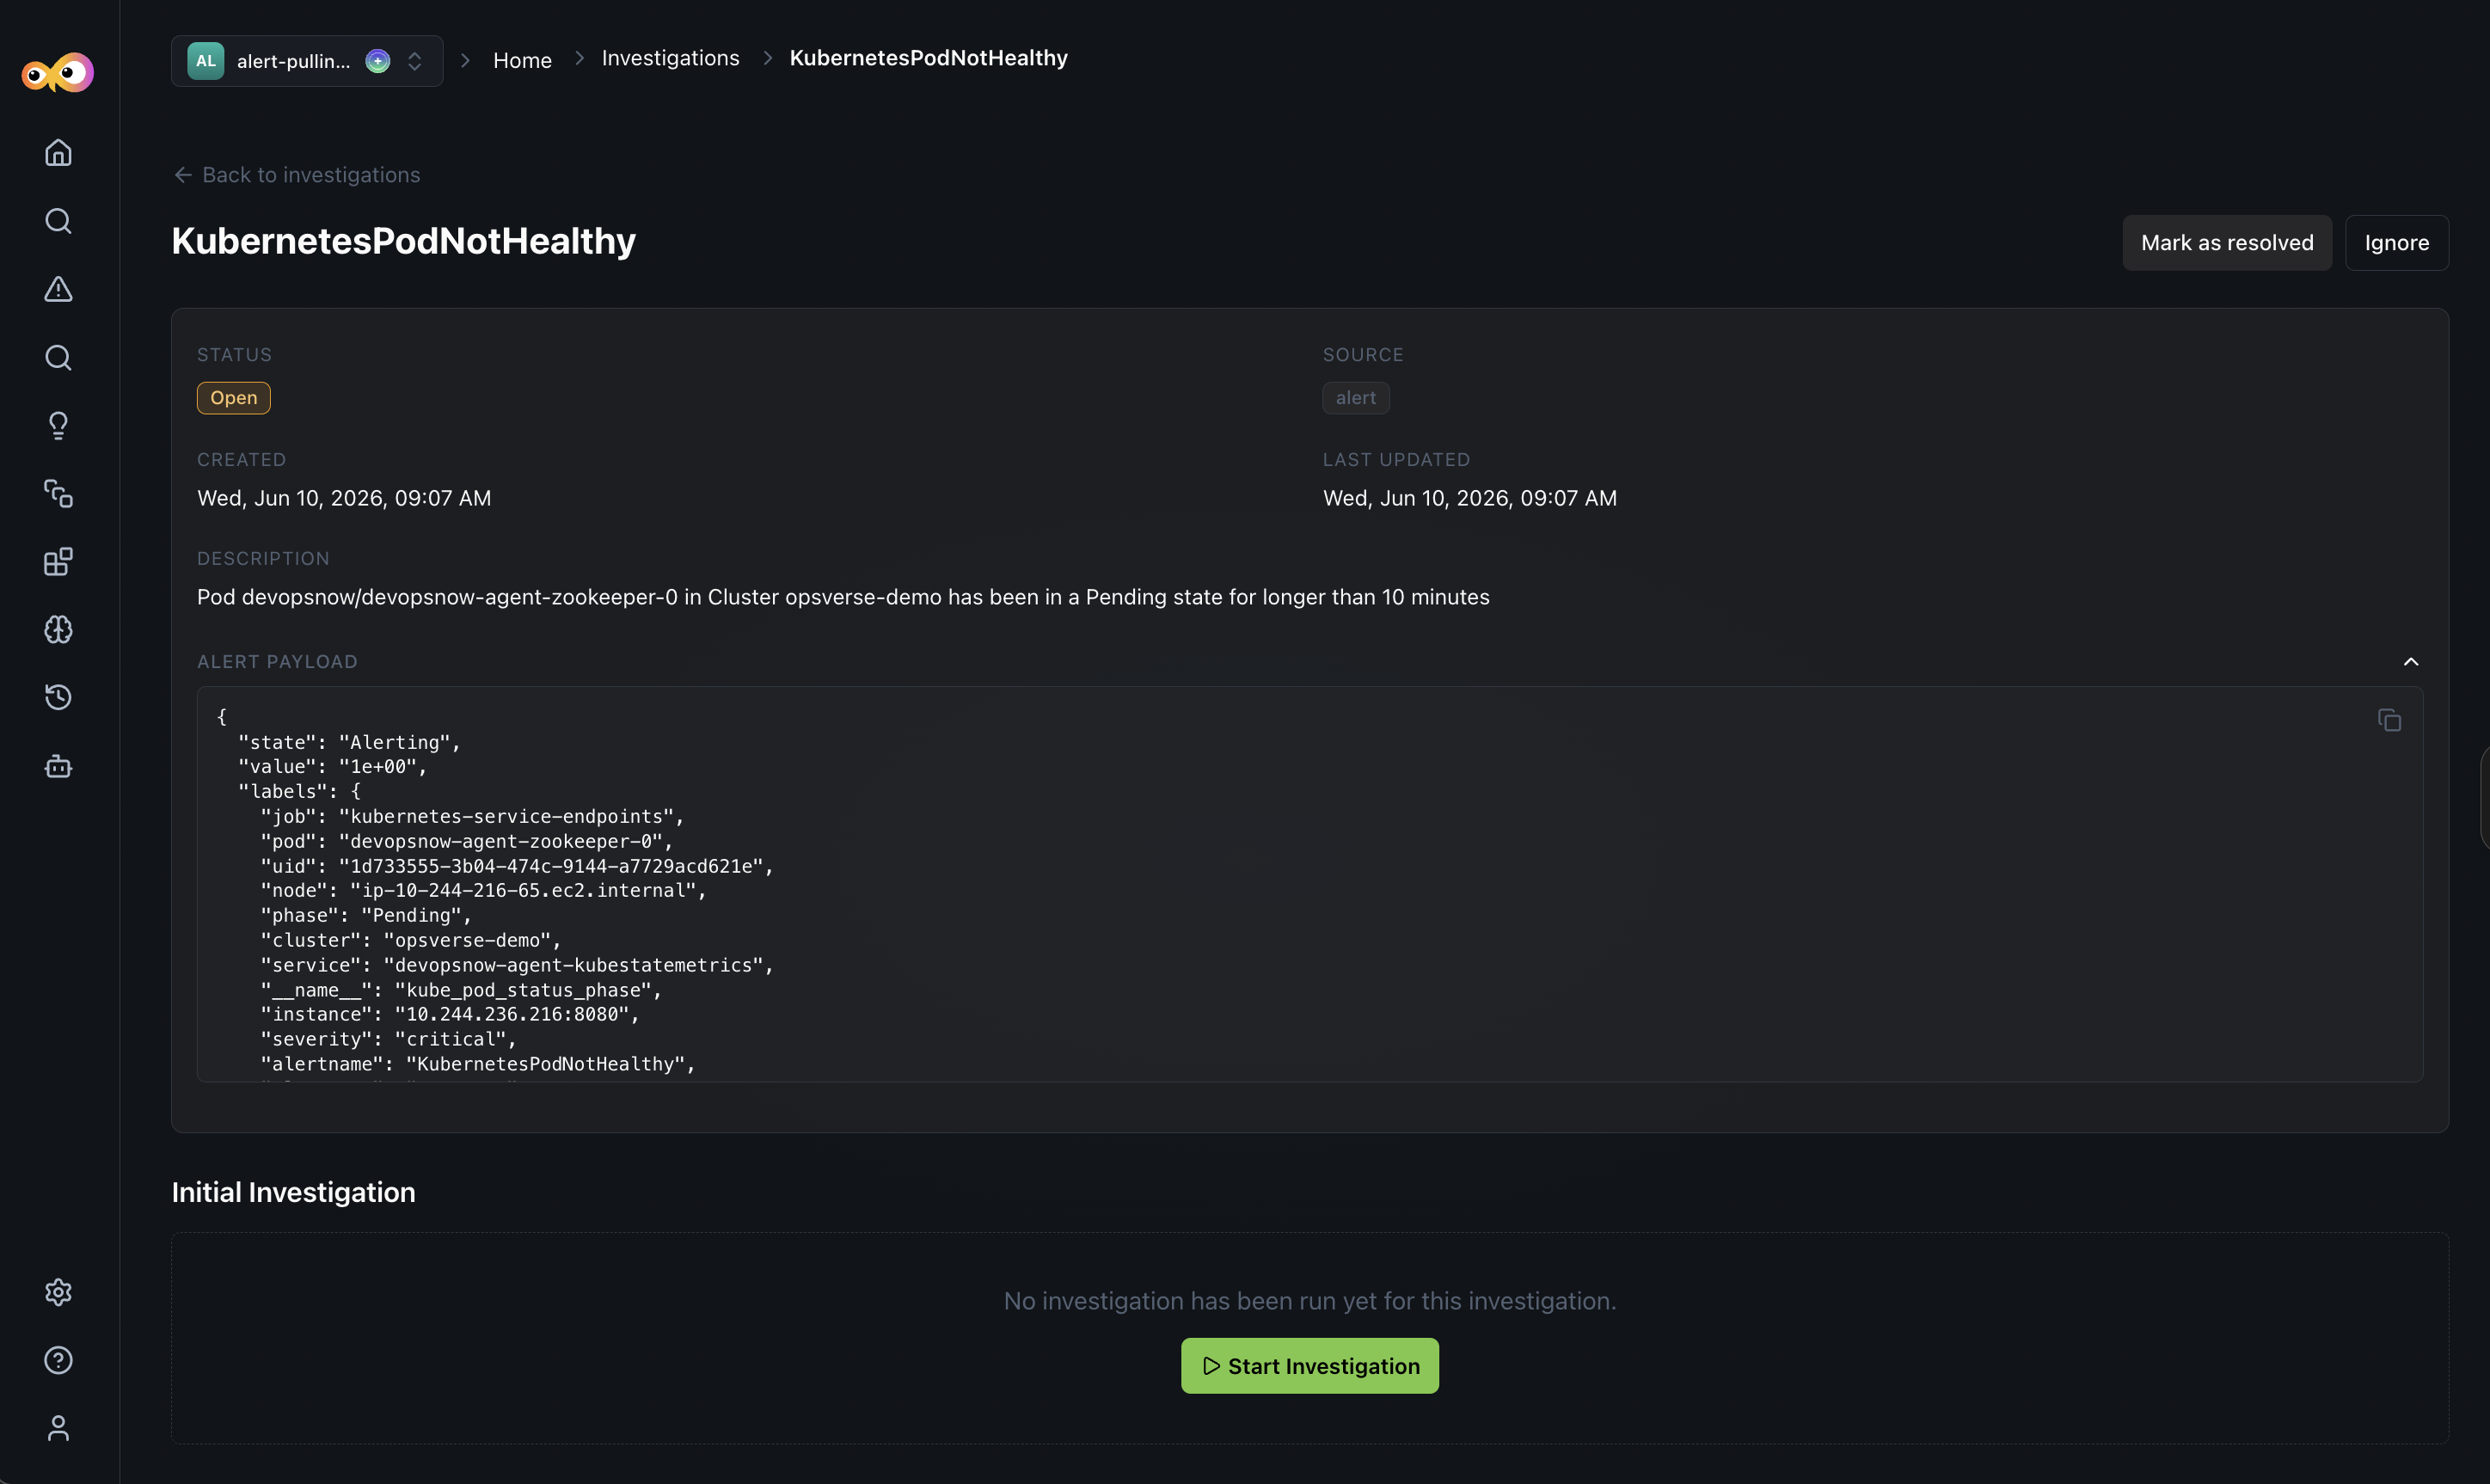
Click Start Investigation for Aiden to analyze the alert payload, query related services, and produce a structured root cause report. This typically takes 30-90 seconds depending on payload complexity.
If Auto-investigate is enabled in your alert configuration, Aiden starts an investigation automatically the moment a matching alert arrives, no manual trigger is needed. See Configuring Alert Ingestion below.
Investigation Results
Once an investigation is completed, you will see an RCA report. The investigation report summarizes root cause, supporting evidence, related incidents, and recommended actions. Details and available tabs vary by integration and investigation. Follow the suggested next step or review findings as needed.
Once the issue is resolved, you can either Mark as resolved, Ignore start a New Conversation using the investigation summary and prompt Aiden for further actions.
Review Flagged Alerts
Some alerts are triggered without a severity. These are flagged as Needs Review with a green Review button. You'll need to manually assign a severity before Aiden can investigate them.
To review a flagged alert:
- Click the green Review button on any Needs Review alert.
- A modal opens showing the alert name, description, source integration, and metadata.
- Select the appropriate severity: Critical, High, Warning, Medium, Low, or Info, based on the potential impact.
- Click Accept.
You will now see the alert appear under the severity-filtered list and available for investigation.
Configure Alerts
Click Configure alerts on the Alerts page to manage your push integrations. Each integration has its own webhook URL, ingestion filter, and auto-investigate settings.
You can configure the following:
- Auto-investigate: When enabled, Aiden automatically opens an investigation for every alert that passes the ingestion filter. The Automation Details field is the prompt template Aiden uses and the
{{ event }}variable inserts the full alert payload from the incoming webhook. - Ingestion filter: Controls which alerts are ingested into Aiden. Rules use
JMESPathexpressions evaluated against the resolved payload value. You can match All rules (AND) or Any rule (OR).-
For example, filtering alerts based on
event.data.assignees[*].summary equals Aidenwill explicitly list alerts assigned to Aiden. Your source integration (ObserveNow, Grafana, etc.) continues to receive every event, the filter only controls what Aiden acts on. -
To add a new rule, click + Add rule and define the
JMESPathexpression, operator, and value.tipUse the ingestion filter to exclude noisy, low-signal alerts (e.g., dependency updates, scheduled jobs) so that Aiden focuses on incidents that require human intervention.
-
Each integration panel includes setup instructions to connect your monitoring tool to Aiden. To set it up, copy the webhook URL shown at the top of the panel and add it as an alert destination in your monitoring tool (for example, in Grafana go to Settings → Alerting → Destinations). Once connected, alerts from that tool will be pushed to Aiden automatically.
Additional Resources
- Aiden SRE: Enable SRE mode and complete onboarding
- Integrations: Supported integrations for alert ingestion
- Discovery: View clusters, services, and data sources discovered from your integrations
- Knowledge Hub: How discovered data and investigation context are used