Logs & Metrics
Logs & Metrics
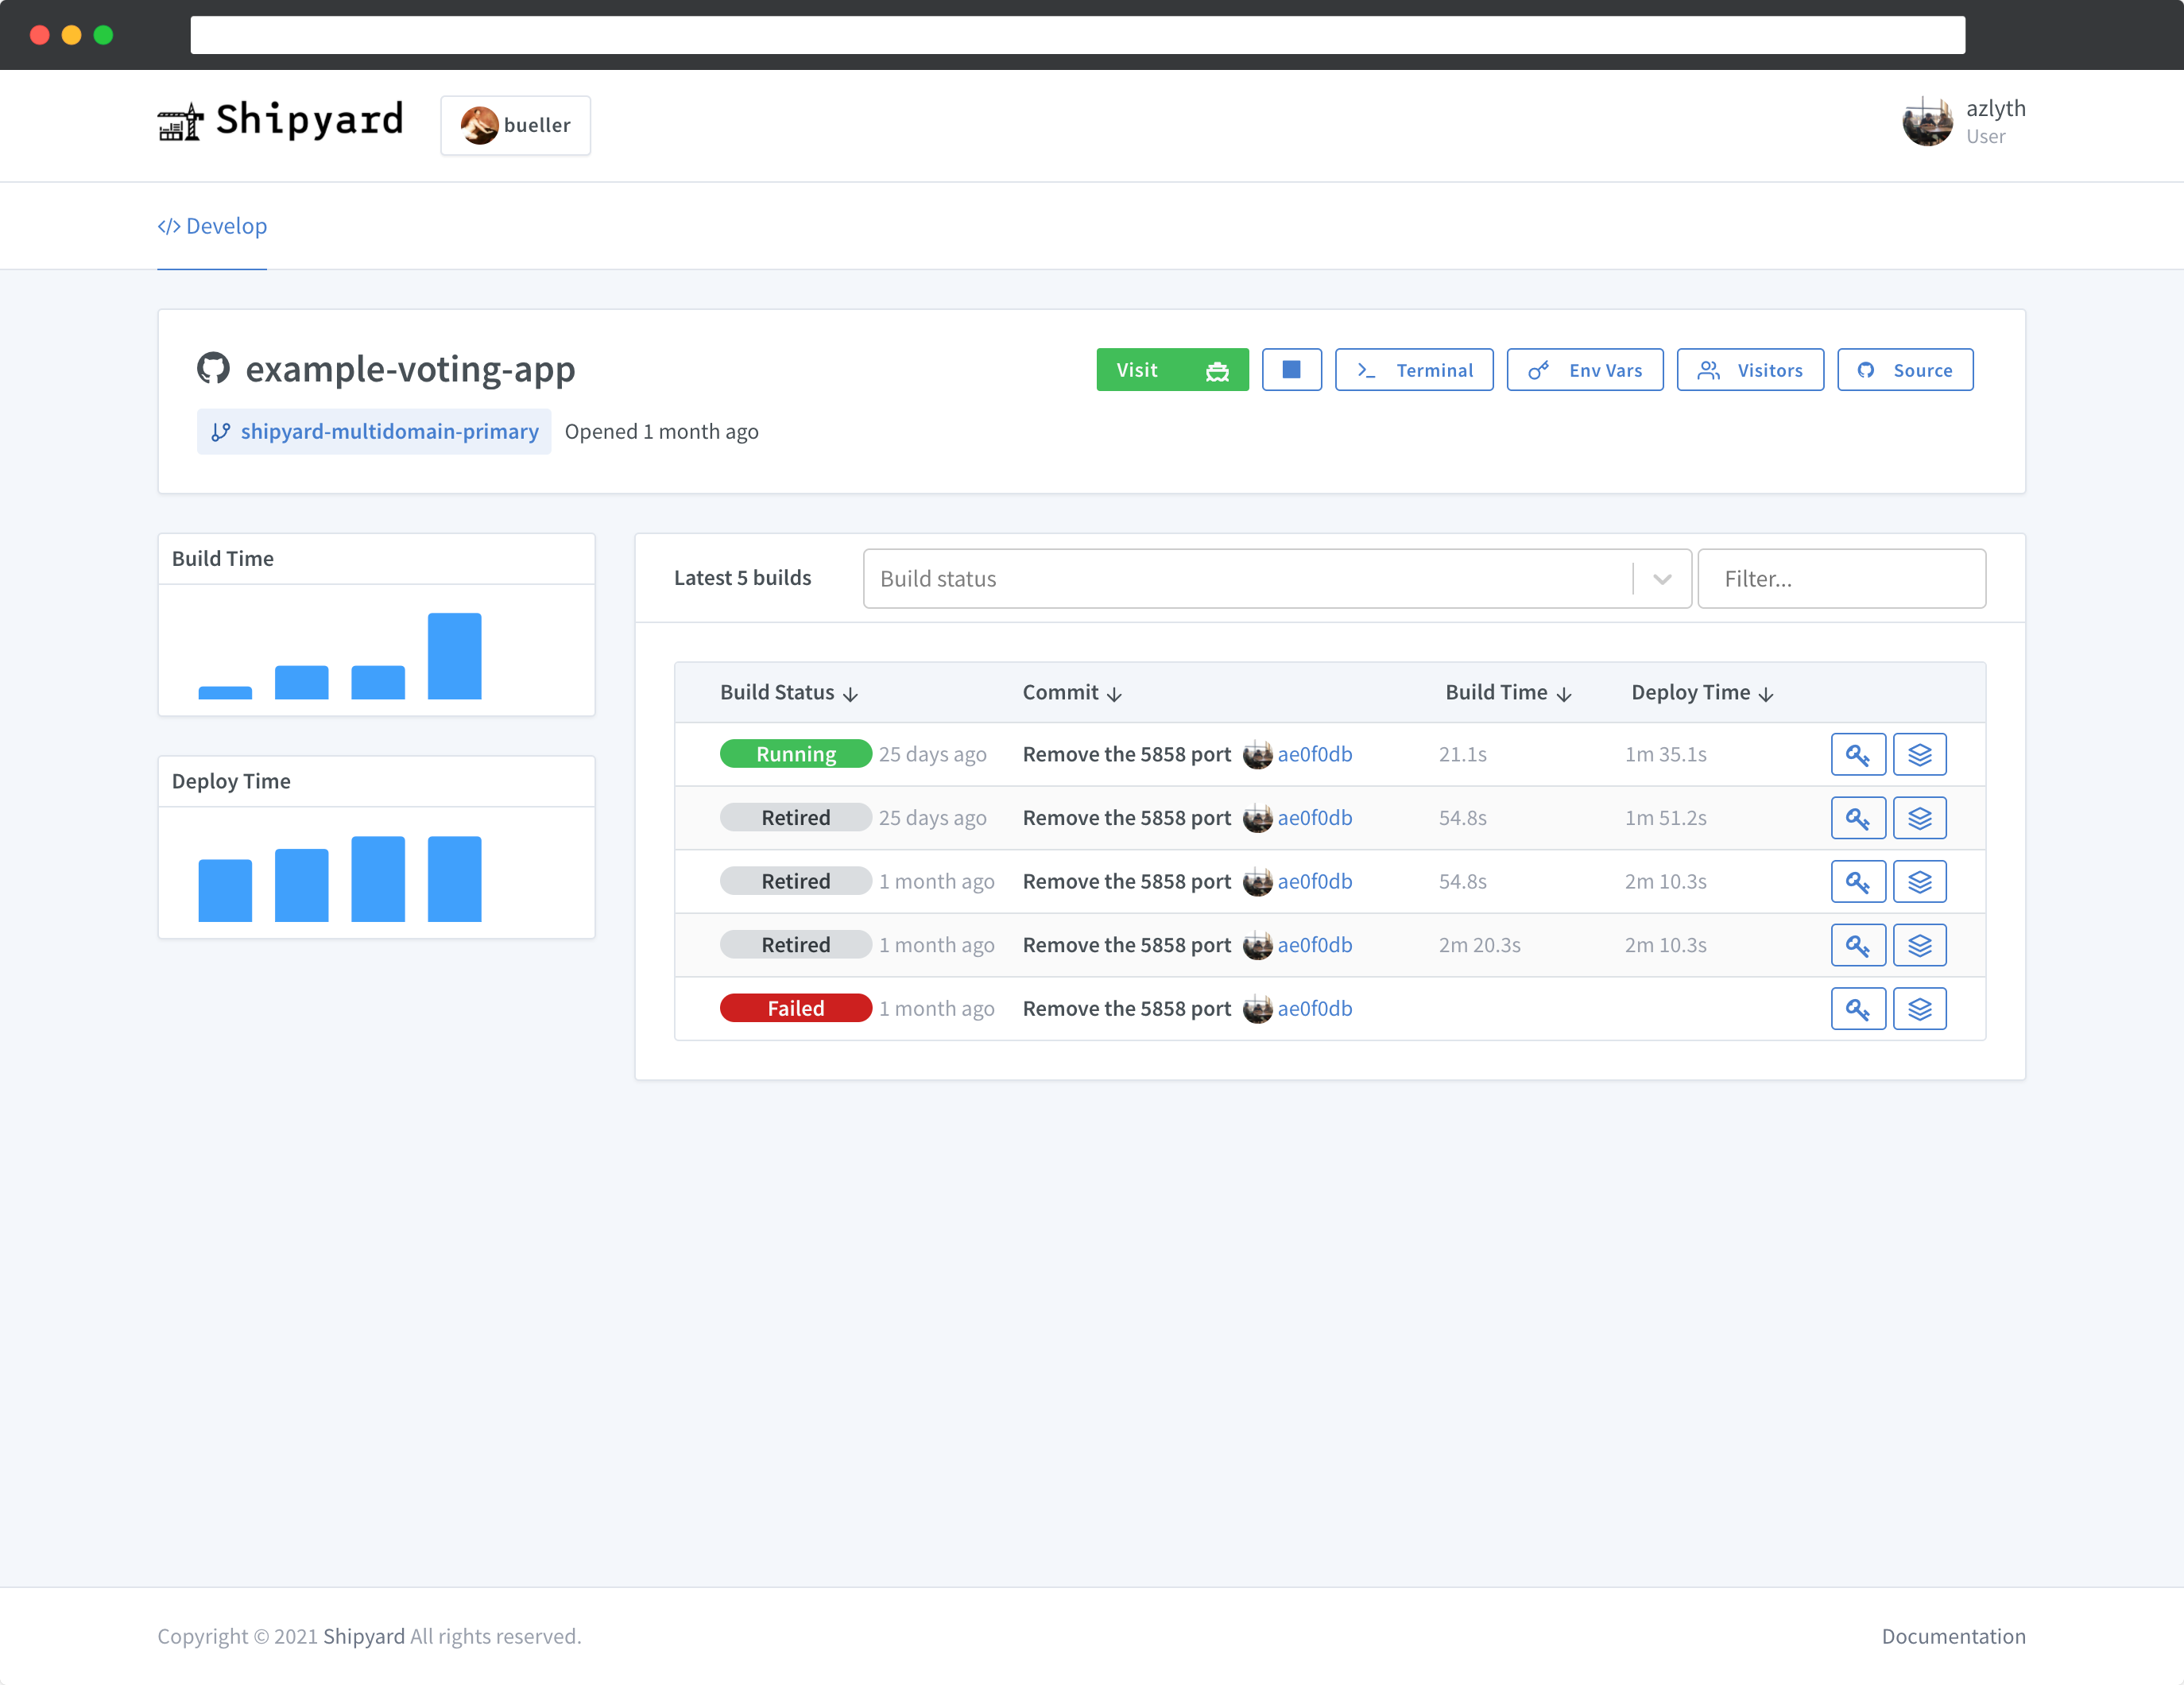
Once your application is queued up for deployment, you can monitor its status on two pages:
- Build Details: see container health, application CPU/Memory metrics, build and run logs
- Application History: overview of build and deploy times across builds (historical data)
Build Details
Once an environment build is queued, you can view the build details by clicking the Details button next to the build on the dashboard.
This page offers the most information in case your application is failing to start.
Here you can restart containers, view crash logs, query CPU/Memory metrics and more.
Each tab displays different information:
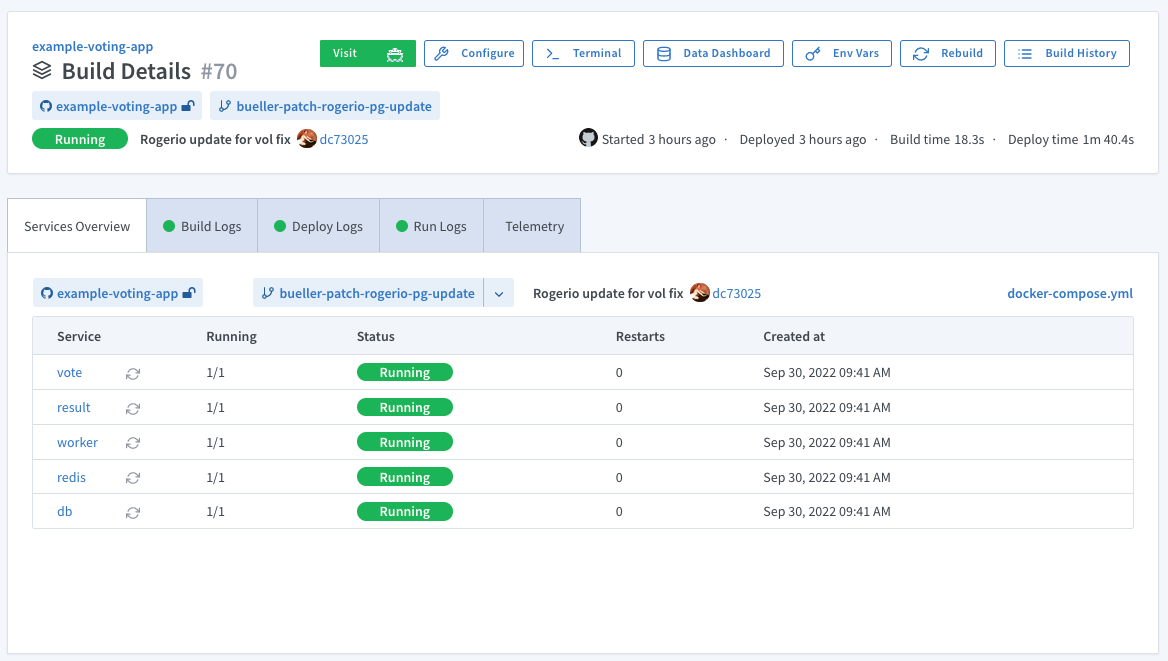
Services Overview
The Services Overview displays the services' health, container statuses, number of restarts, as well as the ability to restart containers:
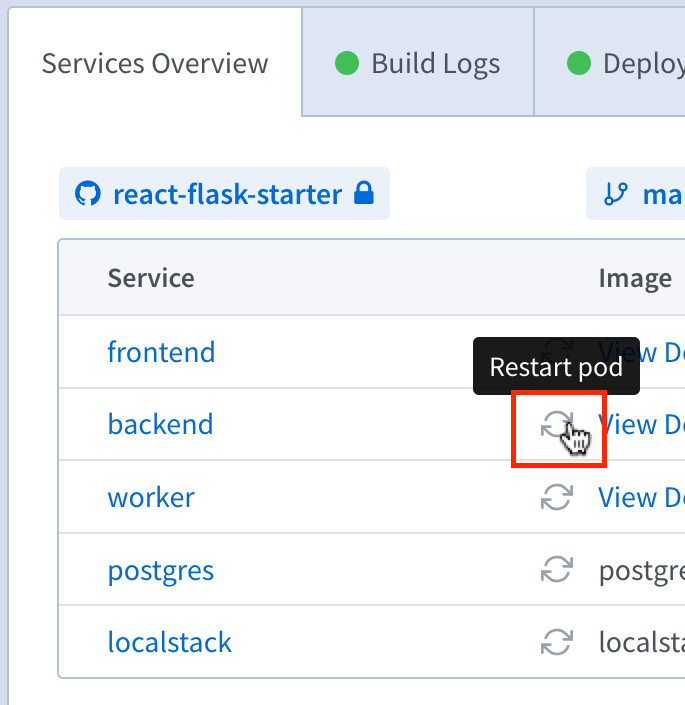
Restart a service
To restart individual pods in your application, click the restart button next to the pod name.
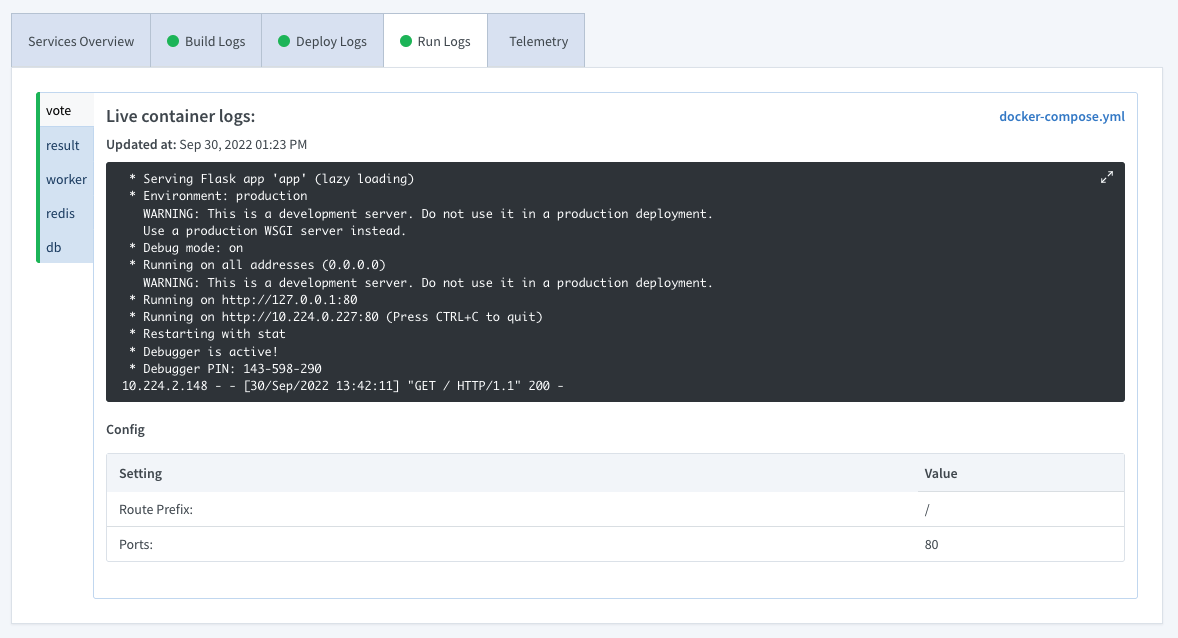
Live Build & Run Logs
These tabs show the live build and run logs (in addition to crash logs for builds that failed), separated by service:
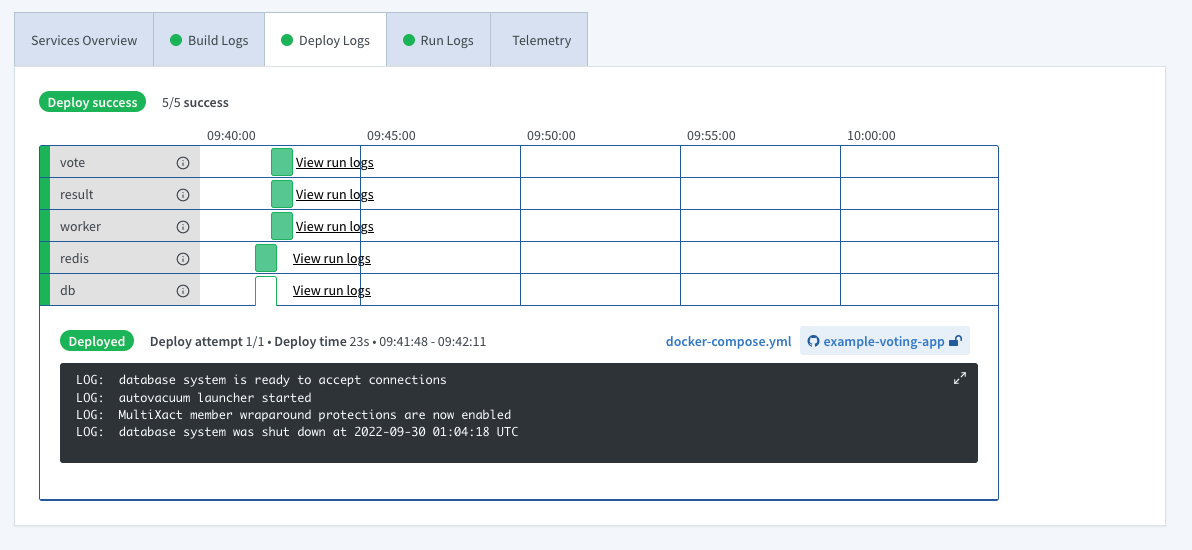
Deploy Timeline
View a table showing the deployment time and logs for each service:
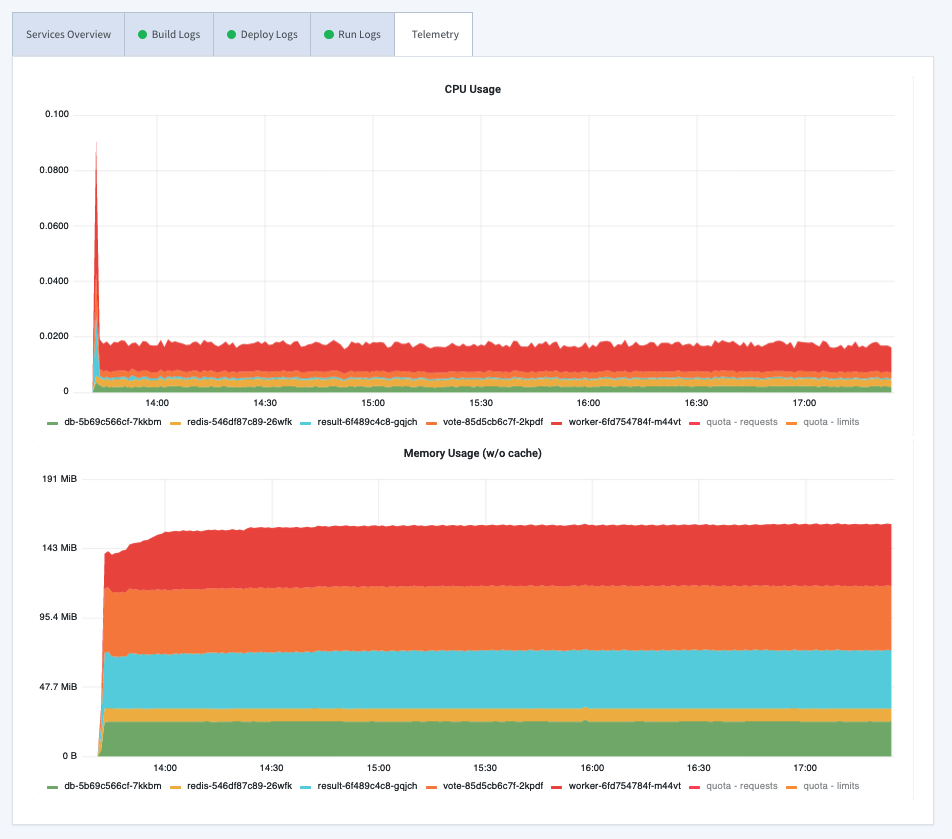
CPU/Memory usage (Telemetry)
View CPU/Memory metrics by service:
Application Build History
Shipyard provides information about all the builds in an environment's lifetime.
Click on the Build History button to view a list of all previous builds for an environment. Here you'll see:
- each build's status
- links to each historical Build Details page
- an overview of build and deploy times