Alert ingestion
Alert ingestion
Use Alerts -> Configure to choose how Aiden receives alerts from each connected integration instance. Use Import alerts on the Alerts page to pull active alerts immediately.
Before starting, connect and attach the integration in the same workspace. The Configure panel lists connected instances grouped by provider.
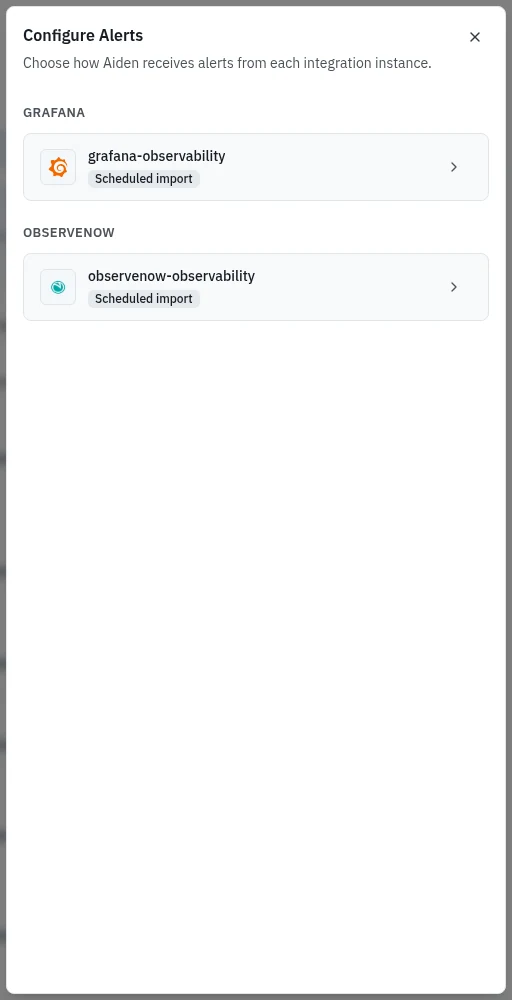
Choose a delivery method
| Source | Webhooks | Scheduled and manual import | What arrives |
|---|---|---|---|
| Grafana / ObserveNow | Yes | Yes | Active alerts |
| Datadog | Yes | Yes | Monitors in Alert or Warn state |
| New Relic | Yes | Yes | Applied Intelligence issues |
| Dynatrace | Yes | Yes | Problems |
| FireHydrant | Yes | Yes | Signals alerts |
| PagerDuty | Yes | Not available | Incident events |
| SquadCast | Yes | Not available | Incident events |
| Coralogix | Yes | Not available | Alert events |
Choose Webhooks for prompt delivery when the provider can push events. Choose Scheduled import to poll on a cadence, or Manual to pull only when requested. The UI marks unavailable import methods Coming soon. Available instances depend on your workspace connections.
Set up a webhook
- Open Configure, expand an integration instance, and select Webhooks.
- Select Add new webhook. This immediately registers an endpoint and opens its setup dialog.
- Copy Webhook URL into the source provider using the instructions under How to setup webhook. When the dialog provides a payload template, use that template so the expected fields reach Aiden.
- Configure Ingestion filter, Auto-investigate alerts, and optionally Allowed CIDRs. See Filters before enabling rules.
- Select Save changes to persist those settings.
- Verify a delivery from the provider and check the resulting alert in Alerts, including its source and payload.
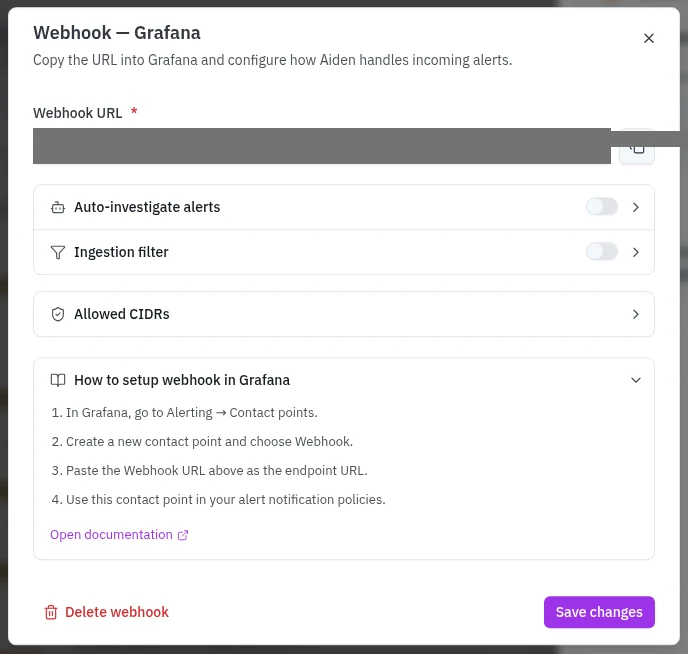
The URL contains credentials; share it only with the sending system. Allowed CIDRs accepts comma-separated sender IP ranges. Leaving it empty skips IP allowlist filtering.
Closing the dialog does not delete the registered webhook. Reopen its card to edit it or choose Delete webhook and confirm removal. Deleting the endpoint stops delivery to that URL; also update the sending provider if it still references it.
Provider details that affect delivery
| Provider | Check in the sending system |
|---|---|
| Grafana / ObserveNow | Create a Webhook contact point and route notification policies to it. |
| Datadog | Configure the webhook with the supplied payload template and include @webhook-<name> in monitor notifications. |
| FireHydrant | Subscribe to Signals Alerts, including opened and resolved events. Incident-only subscriptions do not ingest alerts into SRE. |
| PagerDuty | Use the V3 webhook envelope and subscribe to triggered and resolved incident events; reopened events can also be included. |
| New Relic | Route the relevant workflow to the webhook destination and use the supplied payload template. |
| Dynatrace | Attach the problem notification to the intended alerting profile. |
| SquadCast | Use an automatic V2 webhook with the standard payload and the triggered, priority-updated, and resolved triggers. |
| Coralogix | Use the supplied generic-webhook payload template and enable resolved notifications. |
The app's setup accordion includes a provider documentation link for the full configuration procedure.
Configure scheduled import
- Expand an instance in Configure Alerts and select Scheduled import.
- Choose Schedule: Manual, Every 15 mins, Every 1 hr, Daily at 9:00 AM, Weekly Monday 9:00 AM, Every day at..., Every week on..., or Custom (cron).
- For a custom time, review the displayed Run schedule. Scheduled times are in UTC. A cron expression has five fields: minute, hour, day of month, month, and weekday. For example,
0 9 * * 1runs on Mondays at 09:00 UTC. - Where available, set Filter at source. Optionally set Ingestion filter and Auto-investigate alerts.
- Select Save pull config. Reopen the instance to check the saved settings.
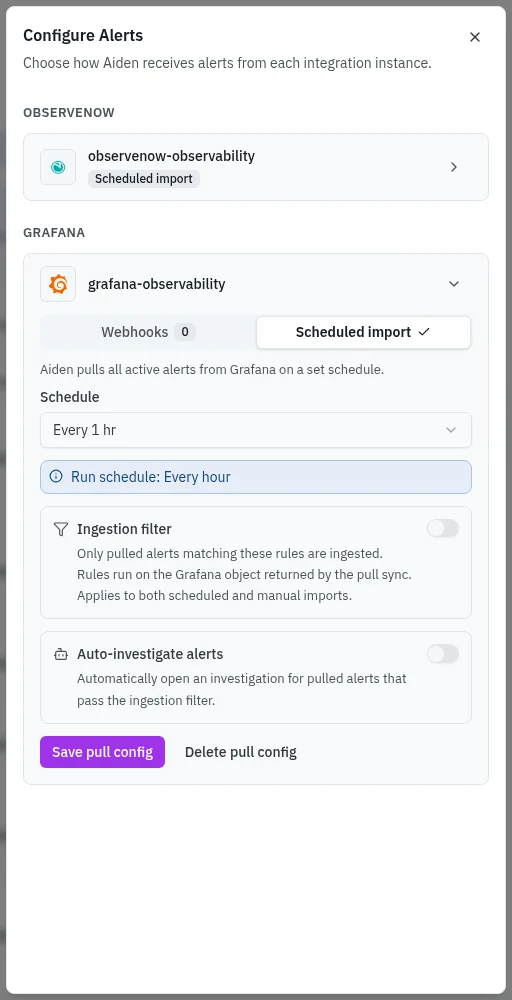
Manual retains a pull configuration without recurring imports. Its saved filters and auto-investigation settings also apply when you import manually. Delete pull config removes that configuration; it is separate from webhook configuration and does not delete existing alerts.
Import active alerts now
- On Alerts, select the Import alerts icon near Configure.
- Select the integration instances to pull from.
- Select Import alerts in the panel and review the completion or error feedback.
- Check the alert queue. Existing alert identities may be updated, so a successful import does not necessarily add a new row for every returned alert.

If no importable integrations are available, connect a supported source first. Close exits the selector without importing.
Automatically start investigations
Enable Auto-investigate alerts separately for a webhook or pull configuration. By default, this applies to ingested alerts that pass the ingestion filter. Only auto-investigate matching alerts adds a narrower rule set. Alerts that fail this additional filter can still enter the queue for manual triage.
This setting starts analysis; it does not authorize mitigation. See From alert to mitigation.
Troubleshoot missing alerts
| Symptom | What to check |
|---|---|
| Instance is absent from Configure | Workspace selection, integration attachment, and provider support |
| Webhook exists but no alert arrives | Provider routing, payload template, delivery result, URL, and allowed sender ranges |
| Import succeeds but alerts are missing | Whether the source returns active alerts, source filtering, ingestion rules, and Active/Ignored queue scope |
| Alert arrives but no investigation starts | The auto-investigate setting for that delivery method and its matching rules |
| Filter matches a webhook but not an import | Webhooks and pull objects have different payload shapes; inspect the relevant payload before reusing a path |
| Recovery is not reflected | The provider's resolved-event subscription and delivery result; compare its current state with the SRE alert |