Discovery
Discovery
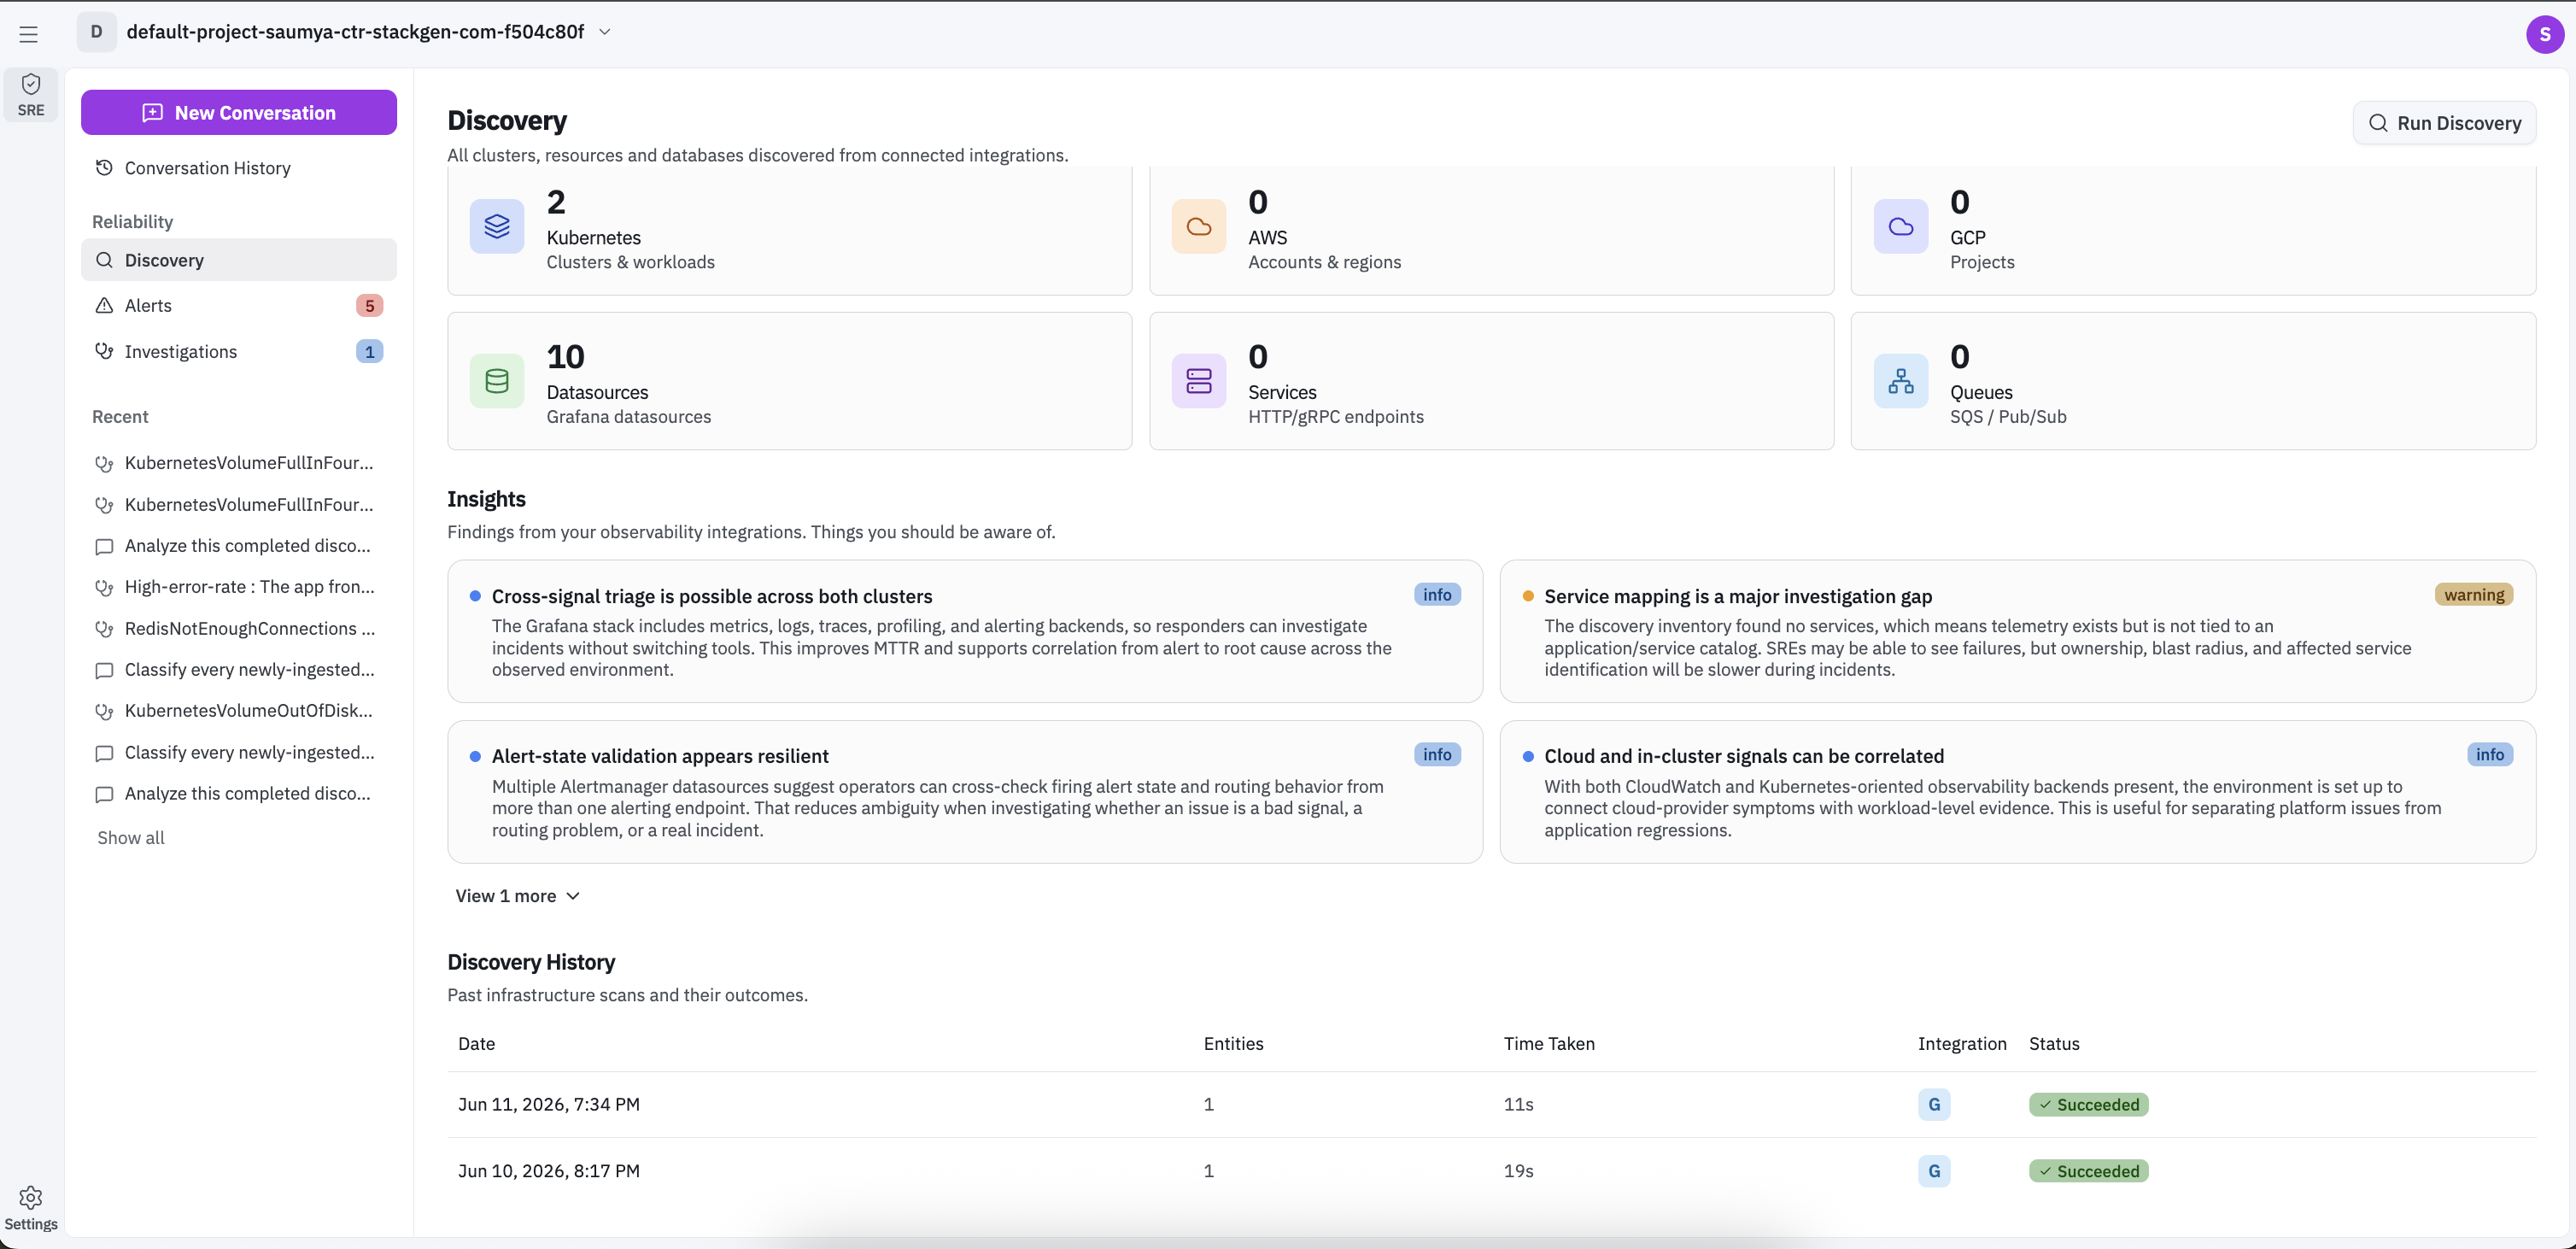
Discovery identifies all the entities across your observability stack: telemetry, databases, data sources, Kubernetes, and cloud resources from your connected integrations. These entities are added to Aiden's knowledge base so it has the context it needs to investigate and act. Use the Discovery page to validate coverage, spot telemetry gaps, review past runs, and refresh findings with a new scan.
Discovered Entities
The Discovered Entities section shows current counts of all clusters, resources and databases discovered from your connected integrations. Depending on connected sources, this can include:
- Clusters and workloads
- Clouds
- Datasources: Connected telemetry data sources
- Services: HTTP or gRPC endpoints
- Queues: Messaging systems such as SQS or PubSub
Each tile helps you quickly see where coverage is strong and where data may be missing.
Insights
The Insights section highlights findings from your observability data. These cards surface notable patterns such as service mapping gaps, telemetry blind spots, and cross-signal correlation opportunities.
Each card is labeled by severity, for example info or warning, and is designed to help teams prioritize cleanup and instrumentation improvements.
Discovery History
The Discovery History section lists previous scan runs and outcomes.
Each row includes:
- Date: When the run started.
- Entities: Number of entities discovered in that run.
- Time Taken: Total run duration.
- Integration: Integration used for the run.
- Status: Run result, such as Succeeded.
Use this table to confirm the latest successful scan and compare run outcomes over time.
Run Discovery
To run a discovery, follow these steps:
- Click Run Discovery to open the run dialog.
- From the Run Discovery dialog, select one or more integrations to include in the scan.
- Click Run Discovery to start the run.
When the run completes, the Discovery page is refreshed with entity counts, insights, and the history table based on the latest data from selected integrations.