Investigation workspace
Investigation workspace
An investigation opens a conversation with the alert context and supporting panels. Use it to understand what Aiden found, check the evidence behind the explanation, and decide the next action.
Open it through Alerts -> Investigate, Open investigation or View investigation on a linked alert, or an Investigations row. Expand the collapsed app sidebar when you need to return to the alert queue or investigation list.
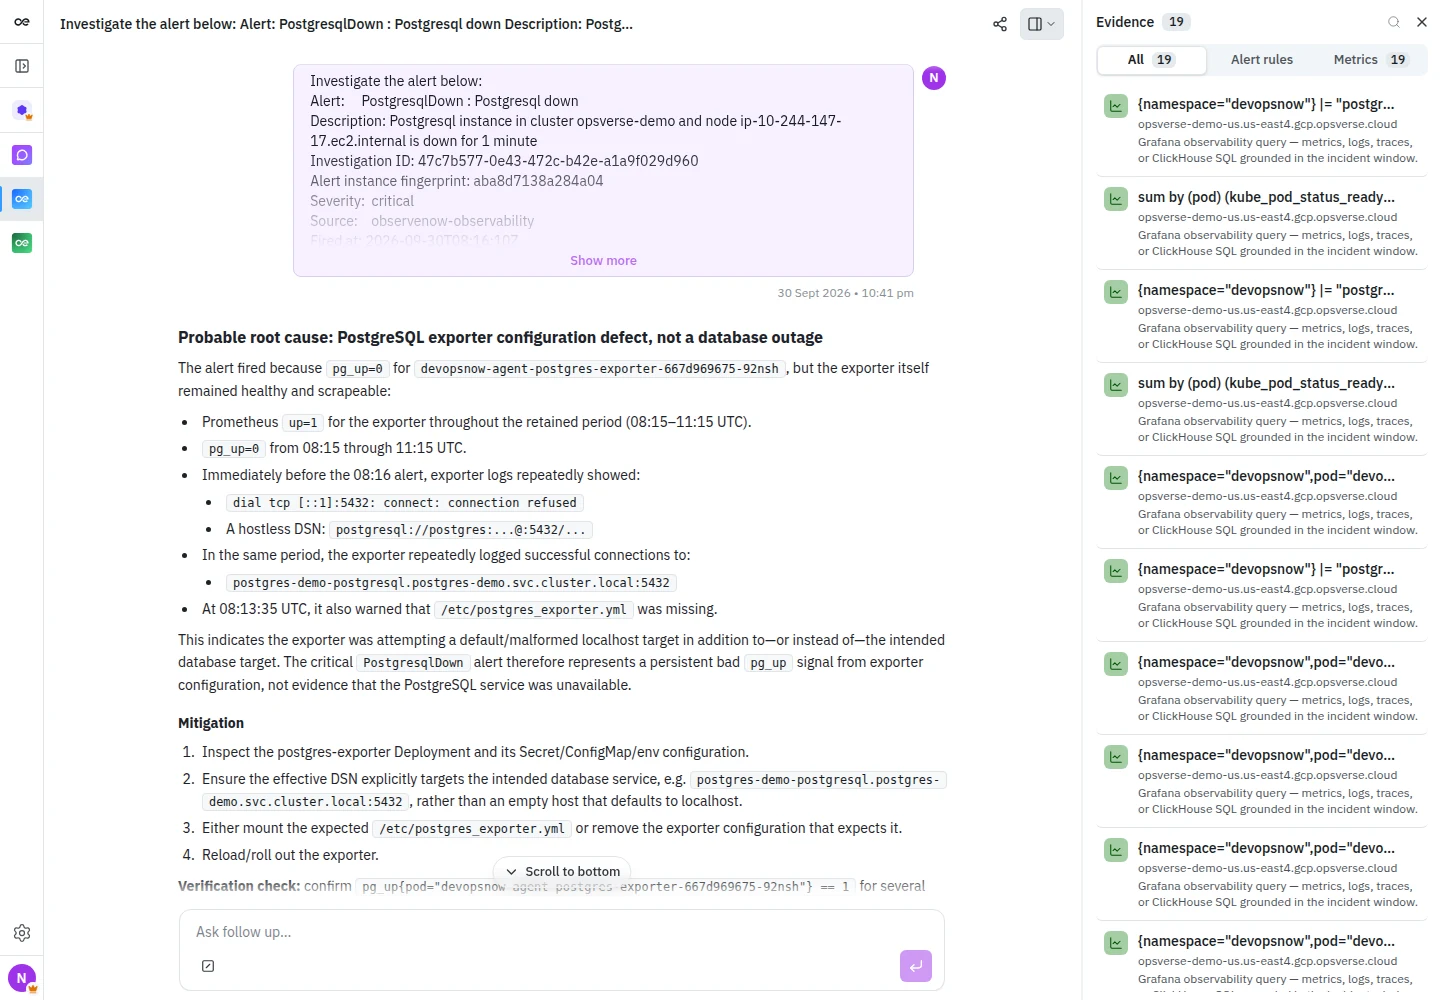
Check the incident context first
Expand Show more on the opening message to read the complete alert context. Confirm the resource or service, source instance, severity, and firing time. The investigation ID and alert fingerprint help distinguish similar-looking cases.
Use the incident time window when reviewing evidence. A healthy metric now does not by itself explain a failure several hours earlier.
Read the result critically
The response may include a probable cause, supporting observations, affected scope, mitigation steps, verification checks, and gaps. Its exact structure depends on the investigation and available evidence.
Separate these questions:
| Question | Look for |
|---|---|
| What happened? | A specific failure mechanism, affected resource, and time window |
| What supports the explanation? | Metrics, logs, alert rules, or other references you can inspect |
| What remains uncertain? | Missing sources, access failures, unverified changes, and alternative explanations |
| What should happen next? | A proposed mitigation and checks that will confirm recovery |
For example, an alert named PostgresqlDown can require checking both the database and its exporter. A successful scrape of an exporter and a failing database-health metric describe different checks. Use the evidence to distinguish them; the alert title alone is not a diagnosis.
Evidence
Open Investigation panels -> Evidence. The panel collects references from the investigation, with All, Alert rules, and Metrics tabs and Search evidence.
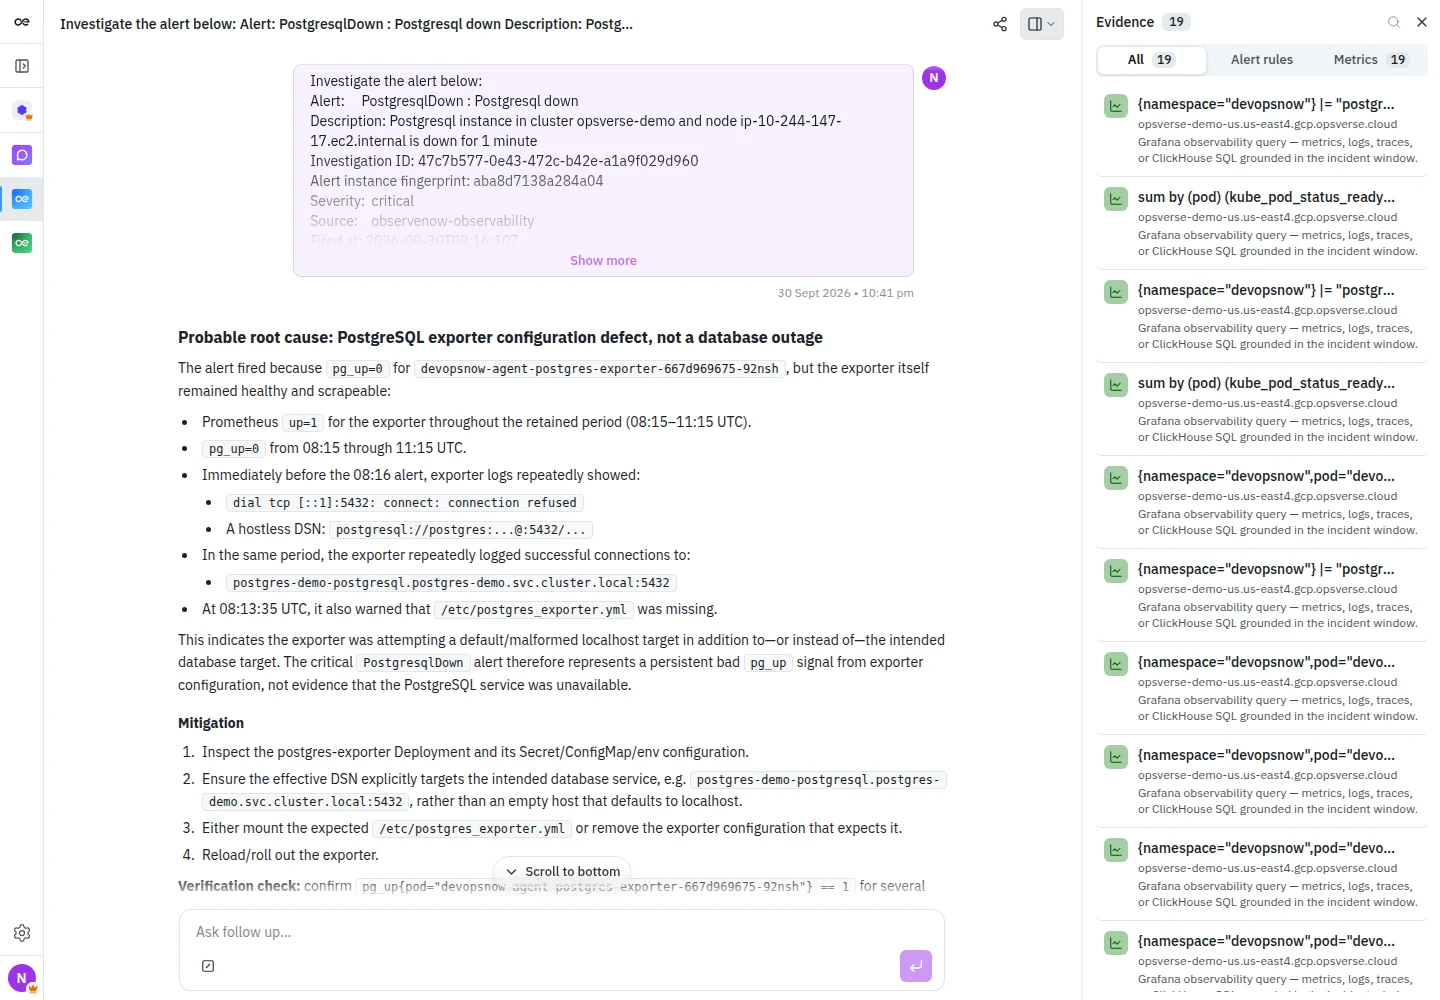
- Select the relevant type or search for a resource or query.
- Read the query or rule title and the displayed source host.
- Open an item in the external console when a link is provided.
- Confirm the datasource, environment, and incident window there before relying on the result.
The Metrics tab can include observability query links for logs, traces, or SQL as well as metrics. Follow the query and datasource information rather than assuming every item is a numeric time series.
No evidence yet can appear while a new investigation runs. If a finished result has no evidence, check Events for failed queries or missing integration access. Closing the Evidence panel only hides it; reopen it from Investigation panels.
Events
Open Investigation panels -> Events to see execution activity. Use All, Tool calls, Agents, or Errors, plus Search events, to narrow the timeline. Events options exposes additional display controls.
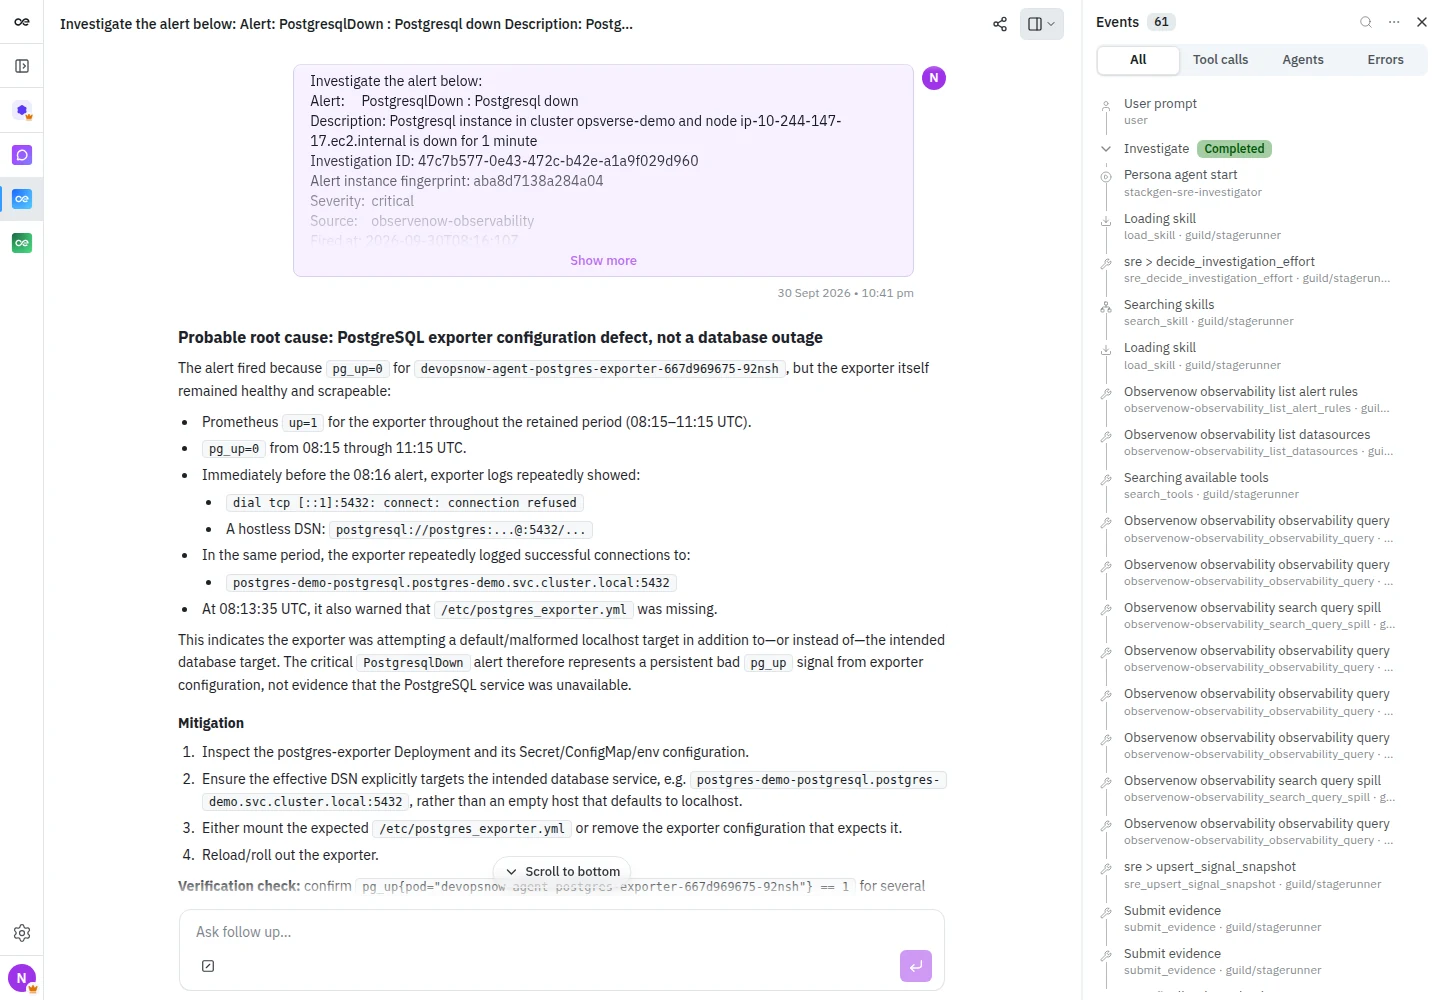
Expand a timeline entry to inspect its available details. Use this panel to answer practical questions: did the expected query run, did a tool fail, and was a step completed? A tool-call entry shows activity; check its result before treating it as success. Events may contain intermediate errors even when later steps recover.
Threads and forks
Open Investigation panels -> Threads to see conversations associated with the alert. Each thread can show its summary, starter, time, and status. Select a thread to switch context.
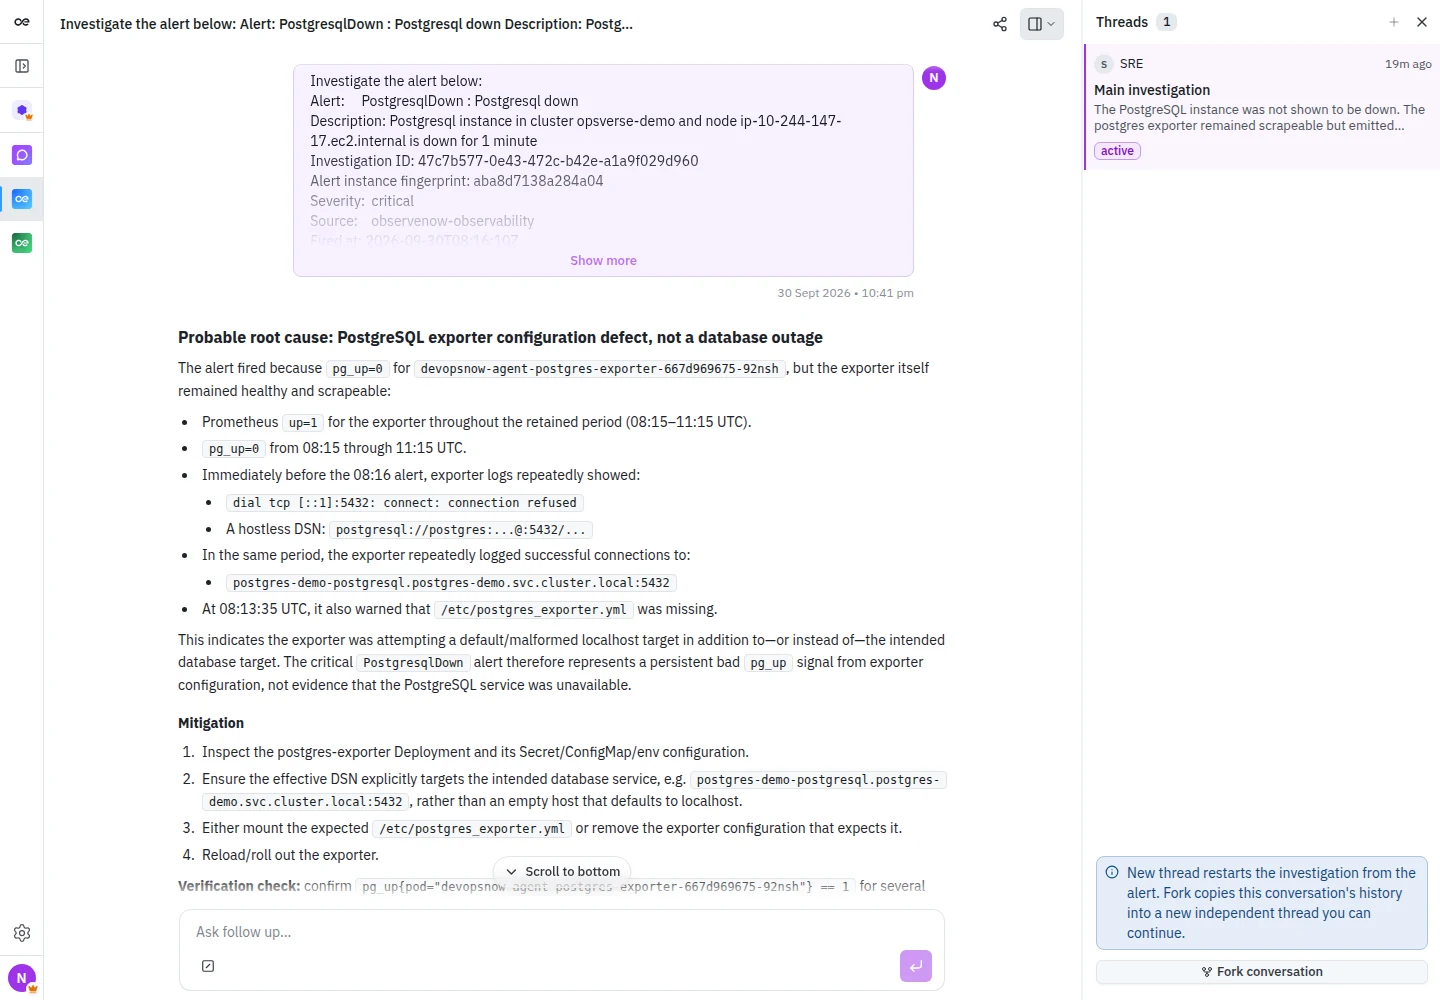
- New thread starts again from the alert context. Use it to re-investigate changed conditions.
- Fork conversation copies the current conversation's history into a new independent thread. Use it to preserve context while exploring a different explanation or next step.
Opening a panel or selecting a thread does not resolve the case. New threads and forks create new work; they are separate from reading an existing investigation.
Ask a useful follow-up
When Ask follow up... is enabled, include the observation or decision you want Aiden to check. For example:
Compare the failing signal with the healthy baseline for this service. Which evidence rules out the other likely causes, and what remains unverified?
Prepare a mitigation plan for this environment, including the target, expected effect, approval needed, rollback, and recovery checks.
The input can be disabled while a response runs. If a completed investigation shows a message that follow-up is blocked, start a new thread or fork from Threads as appropriate.
Use Copy message to copy a finding. Share chat opens the conversation-sharing controls when available. Review what you share, including the resource details and evidence in the conversation.
From proposed mitigation to verified recovery
- Review the plan against the affected environment and your runbook.
- Check required permissions and approvals. A proposed command has not run merely because it appears in the response.
- Carry out the authorized action through the configured tool or workflow, or hand it to the responsible operator.
- Verify the outcome using telemetry, source alert state, and service checks. Ask for a fresh check when conditions change.
- Record the outcome and close the investigation when the response is complete.
For the complete flow and its supporting components, see From alert to mitigation.