Jenkins
Jenkins supports OpenTelemetry and Prometheus metrics plugins that help collect metrics and traces from Jenkins.
Installation
The plugins can be installed via two methods:
- Using the "Plugin Manager" (
Manage Jenkins > Plugins > Available Plugins)in the Jenkins web UI. - Using the Jenkins CLI
Install both the OpenTelemetry and Prometheus metrics plugins.
Configuration
Once the plugins are installed, they need to be configured to send metrics to StackGen's ObserveNow stack. Navigate to Manage Jenkins > System and configure the plugins as following.
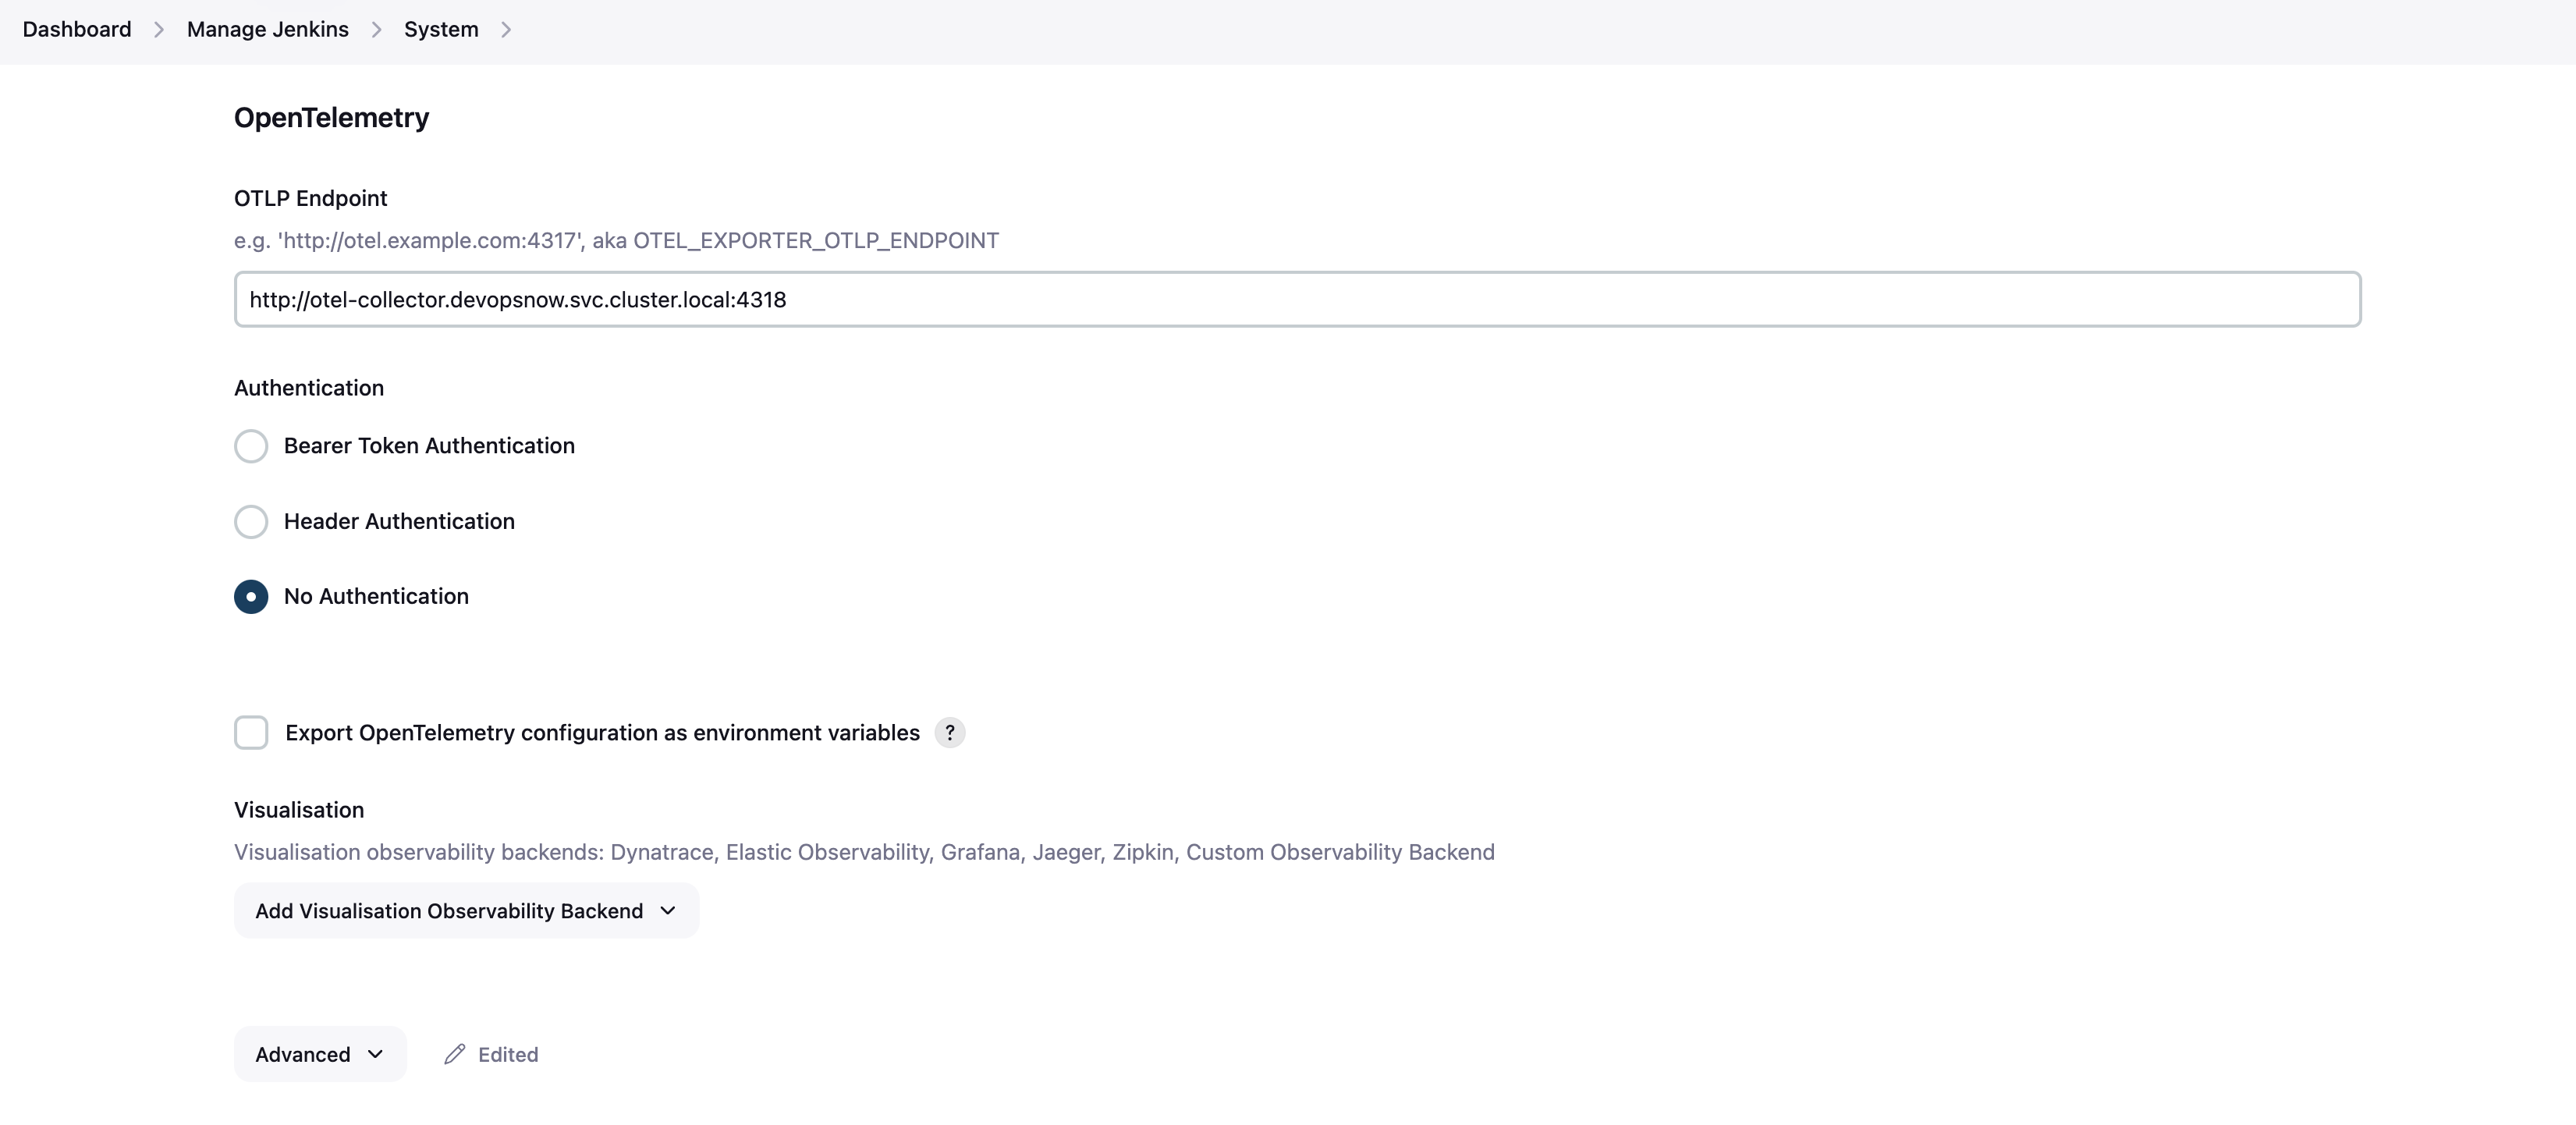
OpenTelemetry
For OpenTelemetry, configure the OTLP Endpoint and set the Exporter Timeout (ms) and Metrics Exporter Interval (ms) inside the Advanced tab as below.
text
OTLP Endpoint = http://otel-collector.devopsnow.svc.cluster.local:4318
Exporter Timeout (ms) = 30000
Metrics Exporter Interval (ms) = 60000
:::
Prometheus
The following annotations must be added in the Jenkins deployment file to enable scraping of metrics via Prometheus. For a bitnami helm chart based Jenkins deployment add the following snippet to the values.yaml file of the Jenkins deployment.
service:
  annotations: {
    prometheus.io/scrape: "true",
    prometheus.io/port: "8080",
    prometheus.io/path: "/prometheus/"
  }
Make sure that the path inside Prometheus system values is set to prometheus(this is the default value for path).
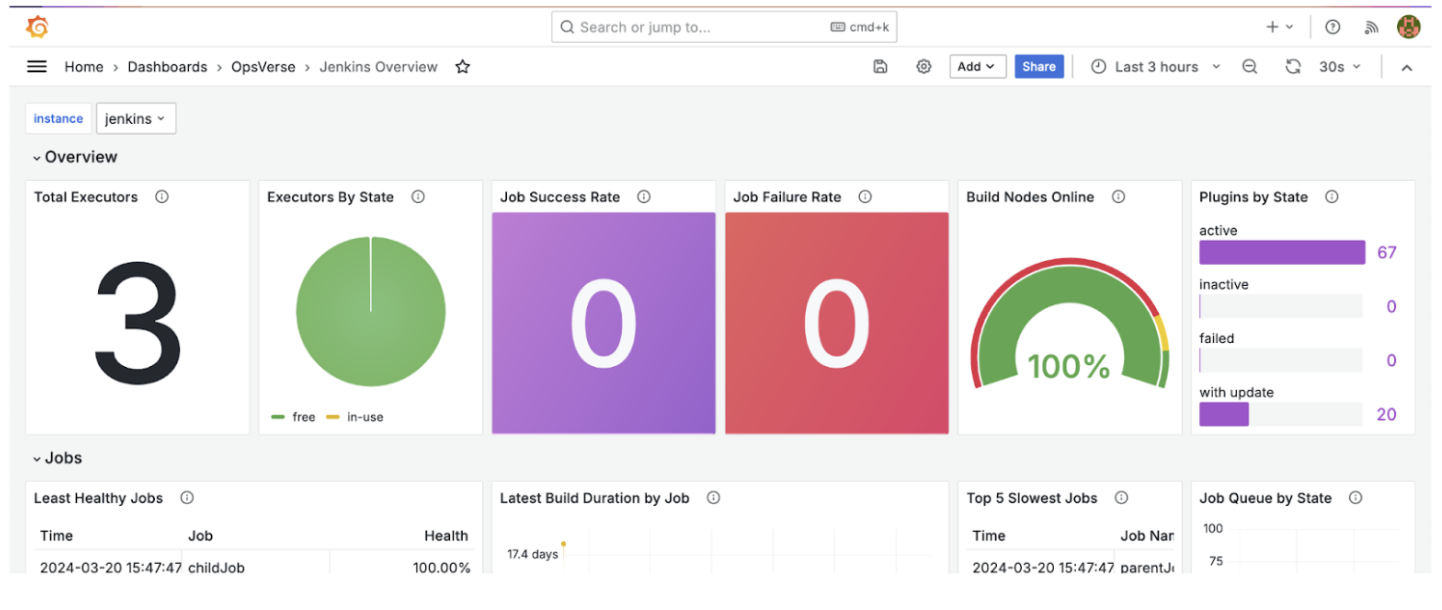
Visualization
Once the required telemetry is enabled, the Jenkins Overview dashboard that is pre-packaged with your ObserveNow stack can be used to visualize incoming traffic.