Shared Dashboards
The Shared Dashboards module by StackGen ObserveNow makes it easy to securely share dashboards using invite-only links, so your customers and stakeholders see exactly what they need and nothing more.
You start by creating your dashboard in Grafana, which is the same dashboarding experience used across ObserveNow. Then you import it into Shared Dashboards, apply the right filters, and share it with recipients.
Any updates you make in Grafana are automatically reflected the next time the shared dashboard is opened, so your data always stays up to date. Each shared link is read-only and scoped, ensuring every recipient sees only the data you have shared.
You remain in full control at all times, with the ability to invite users, monitor access, and revoke permissions whenever needed. This makes it easy to share curated, customer-specific dashboards, whether for MSP client reporting, tenant-level SaaS metrics, or engineering insights with your external stakeholders.
The result: simple, secure, and controlled sharing of observability data, entirely on your terms.
How it Works
Setup covers everything you do before sharing the dashboard, from creating the dashboard in Grafana, importing it into ObserveNow, importing it to Shared Dashboards module, applying the right filters, and sending out invites.
Once that’s done, recipients access the dashboard as described below.
- Authoring: Change panels, queries, and layout in Grafana (packaged with ObserveNow). Those updates appear in Shared Dashboards on the next load. You do not need to re-import the dashboard for routine edits.
- Scoping and sharing: Use the Shared Dashboards module to set filters (variables you defined in Grafana) and to invite recipients; viewers cannot change those filters except where the product allows (for example, Time range).
Apply filters using predefined variables from Grafana before you share a dashboard with your customers, to ensure each recipient sees only the intended and scoped data. These filters remain fixed and cannot be changed by the viewer.
Create a Dashboard
Click to view
Before you share a dashboard, someone with access to Shared Dashboards module in your organisation will have to create it. Follow these steps to create a dashboard:
-
Login to your shared dashboard module via your environment-specific URL. It will be something like:
https://shared-dashboards-<instance>.<region>.stackgen.com
Replace<instance>and<region>with your StackGen deployment details. Check with your admin or [customer support (mailto:support@stackgen.com) if you're unsure. -
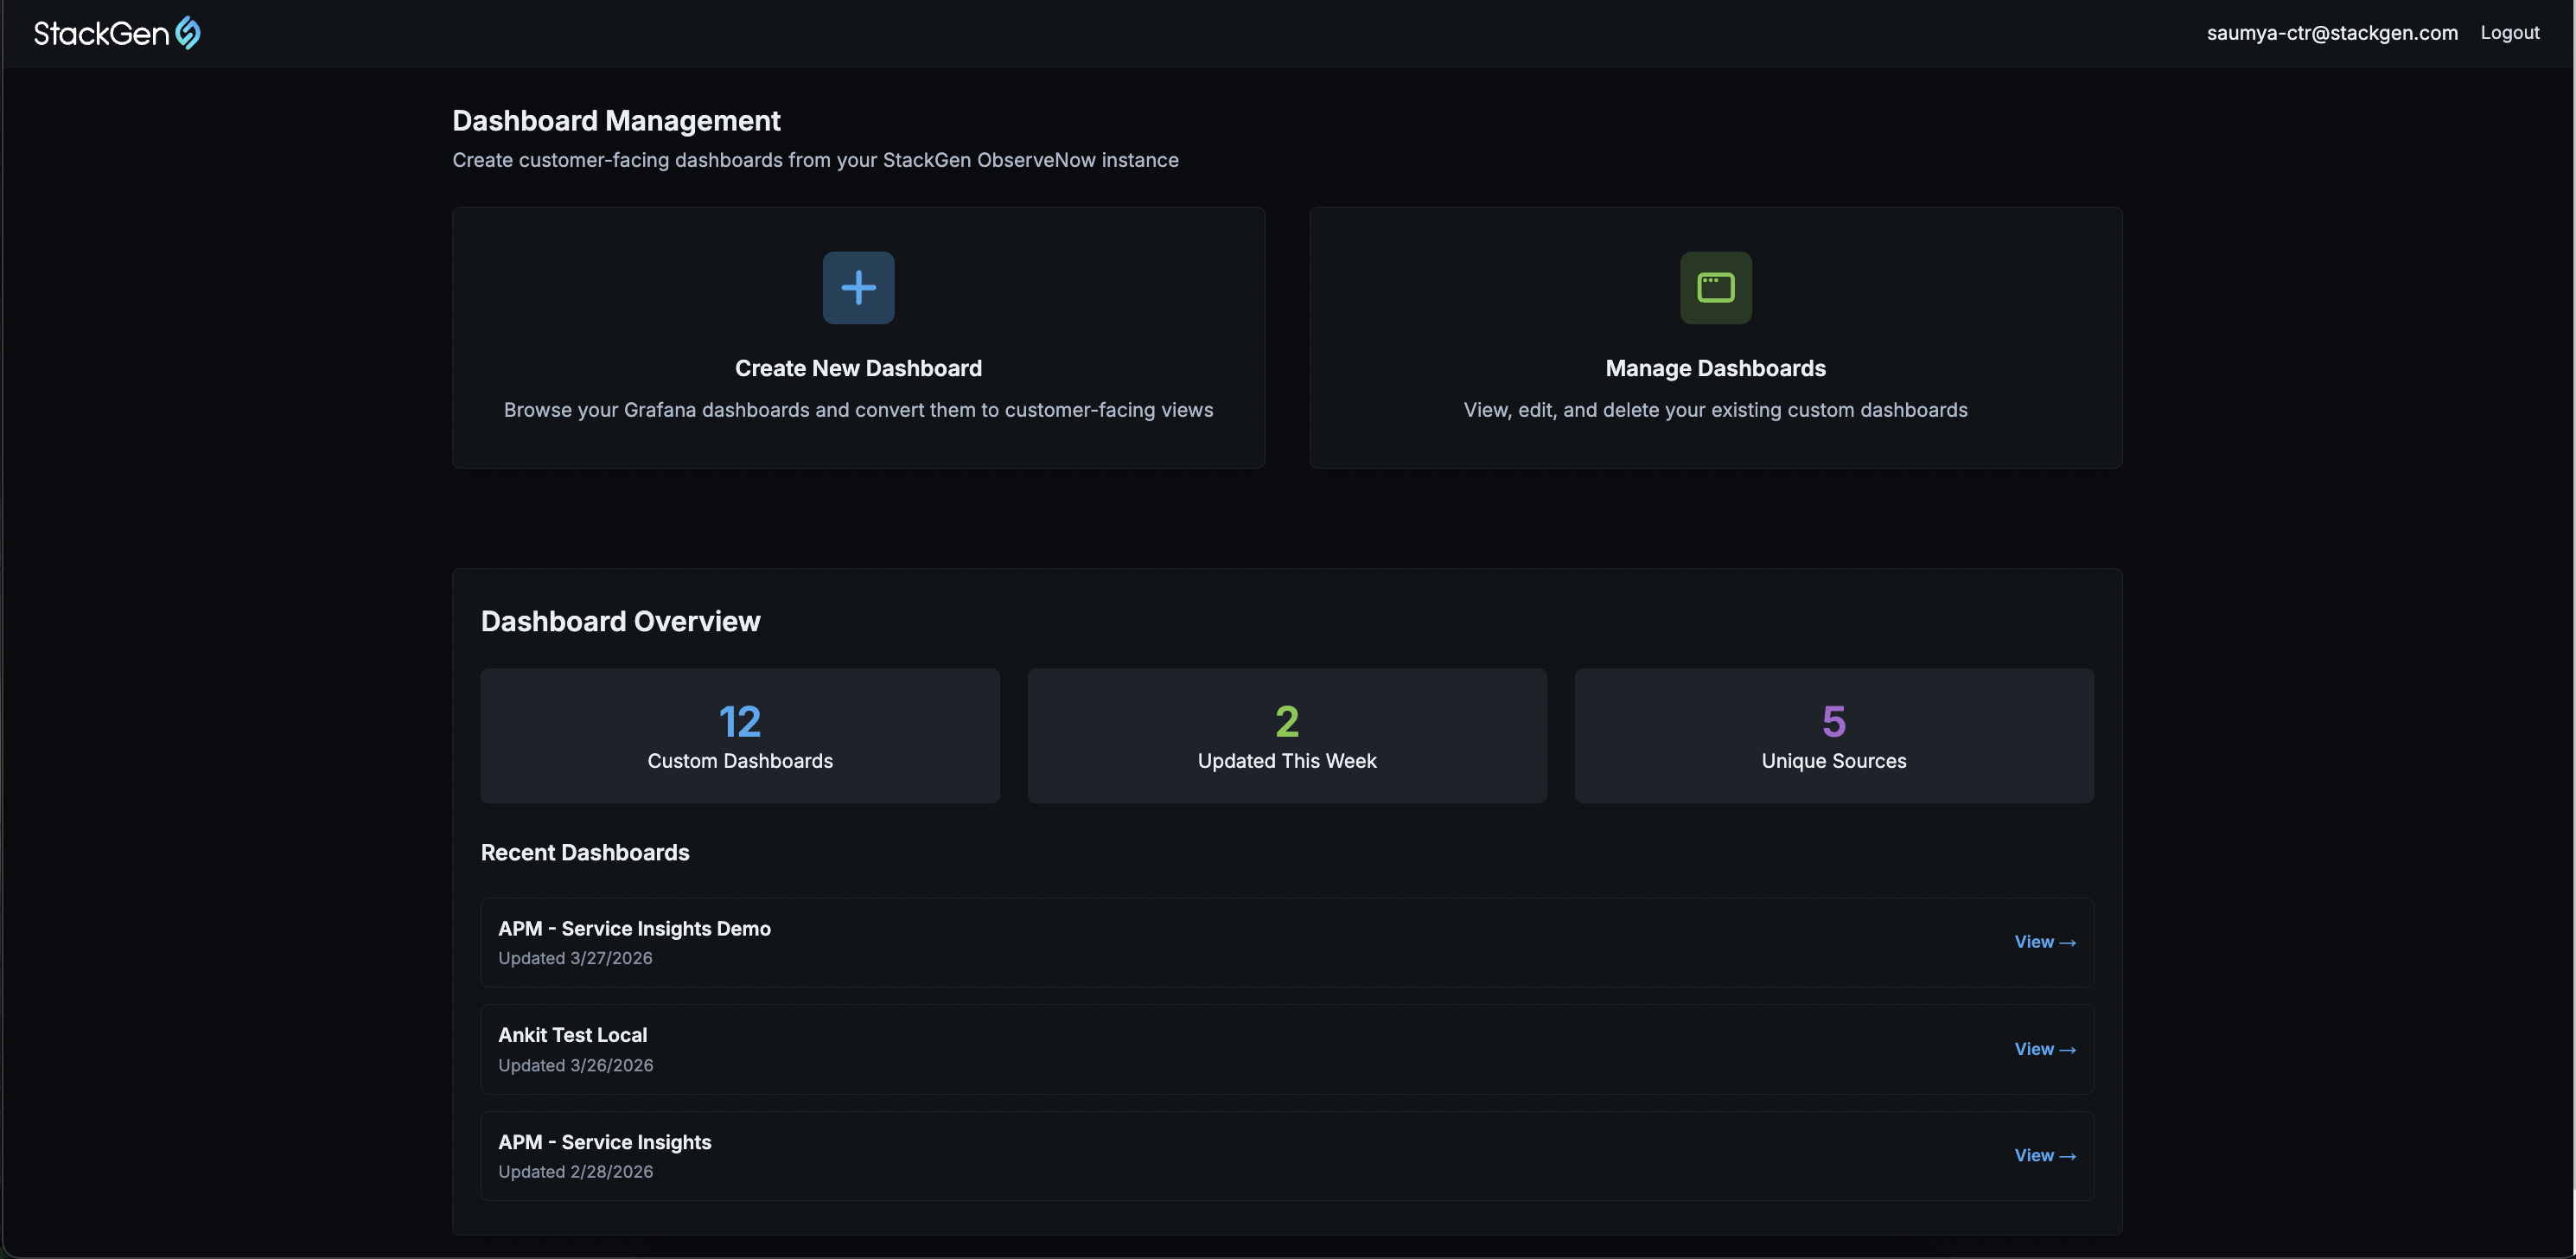
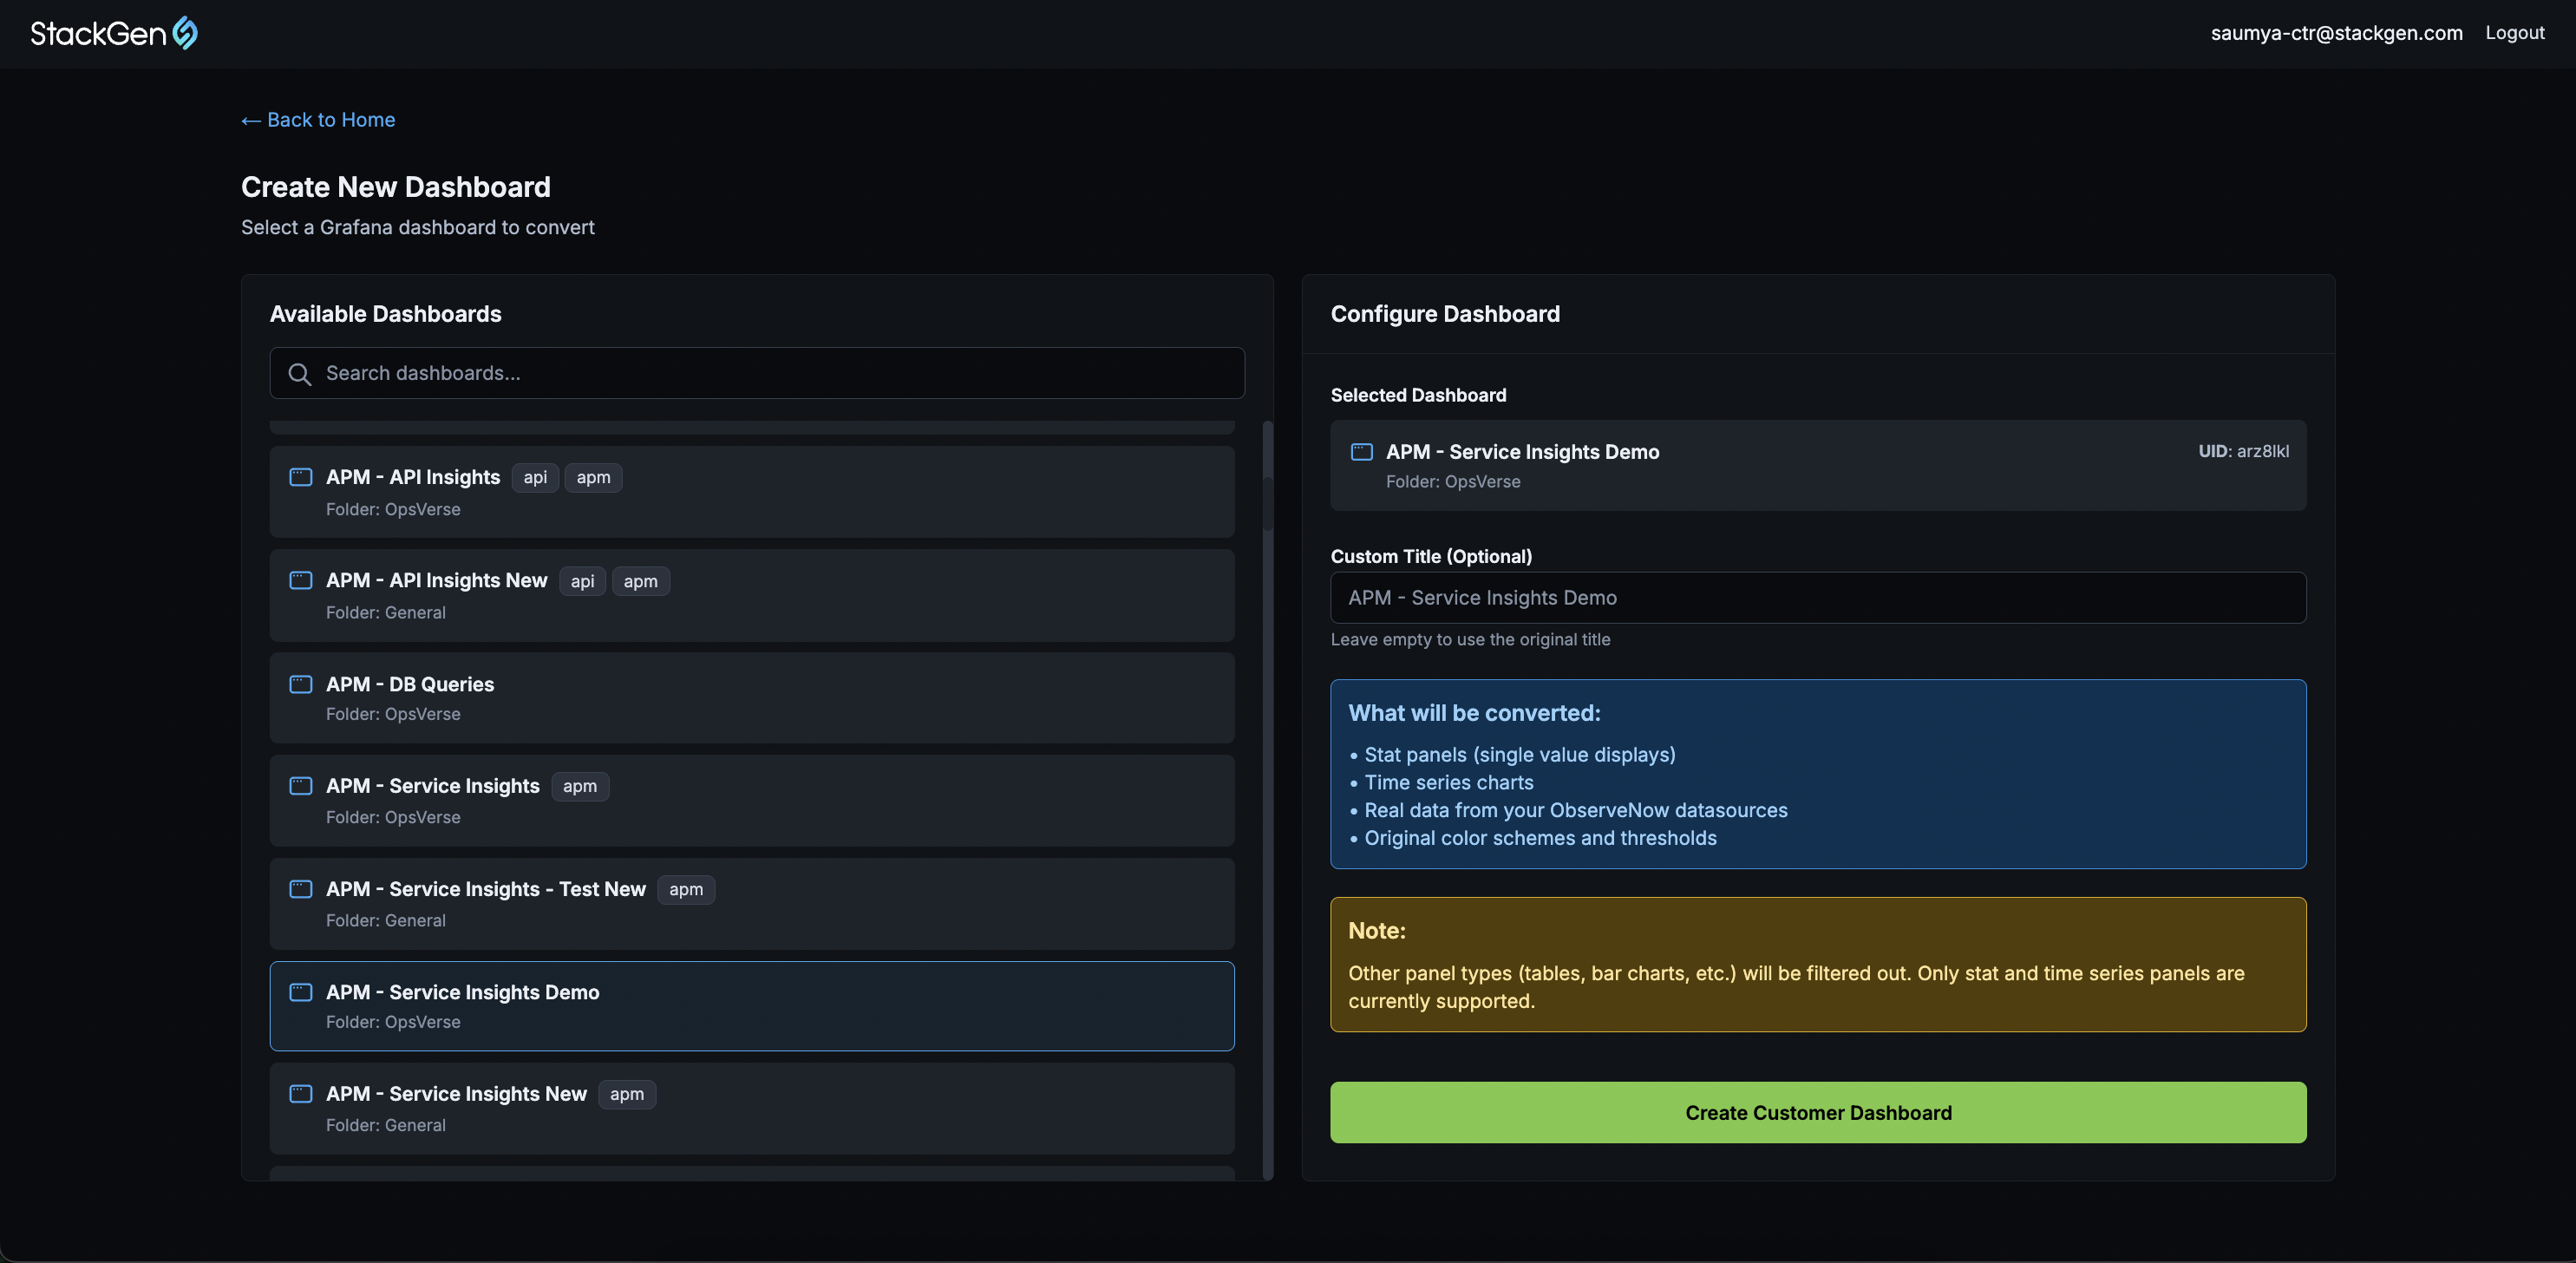
From the Dashboard Management page, click Create New Dashboard.
-
Select the Grafana dashboard you want to import.
-
Optional: Enter a custom title for your dashboard.
-
Click Create Customer Dashboard.
You will be redirected to the newly created dashboard once it is created.
Scope and Share the Dashboard
Click to view
Once you create a dashboard, scope what each recipient can see, then send the invite. Do this every time you need a different slice of data (for example, per customer or tenant).
Scope your Dashboard
-
From the Dashboard Management page, click Manage Dashboards. Scroll down and click View Dashboard → that you want to share with your customers.
-
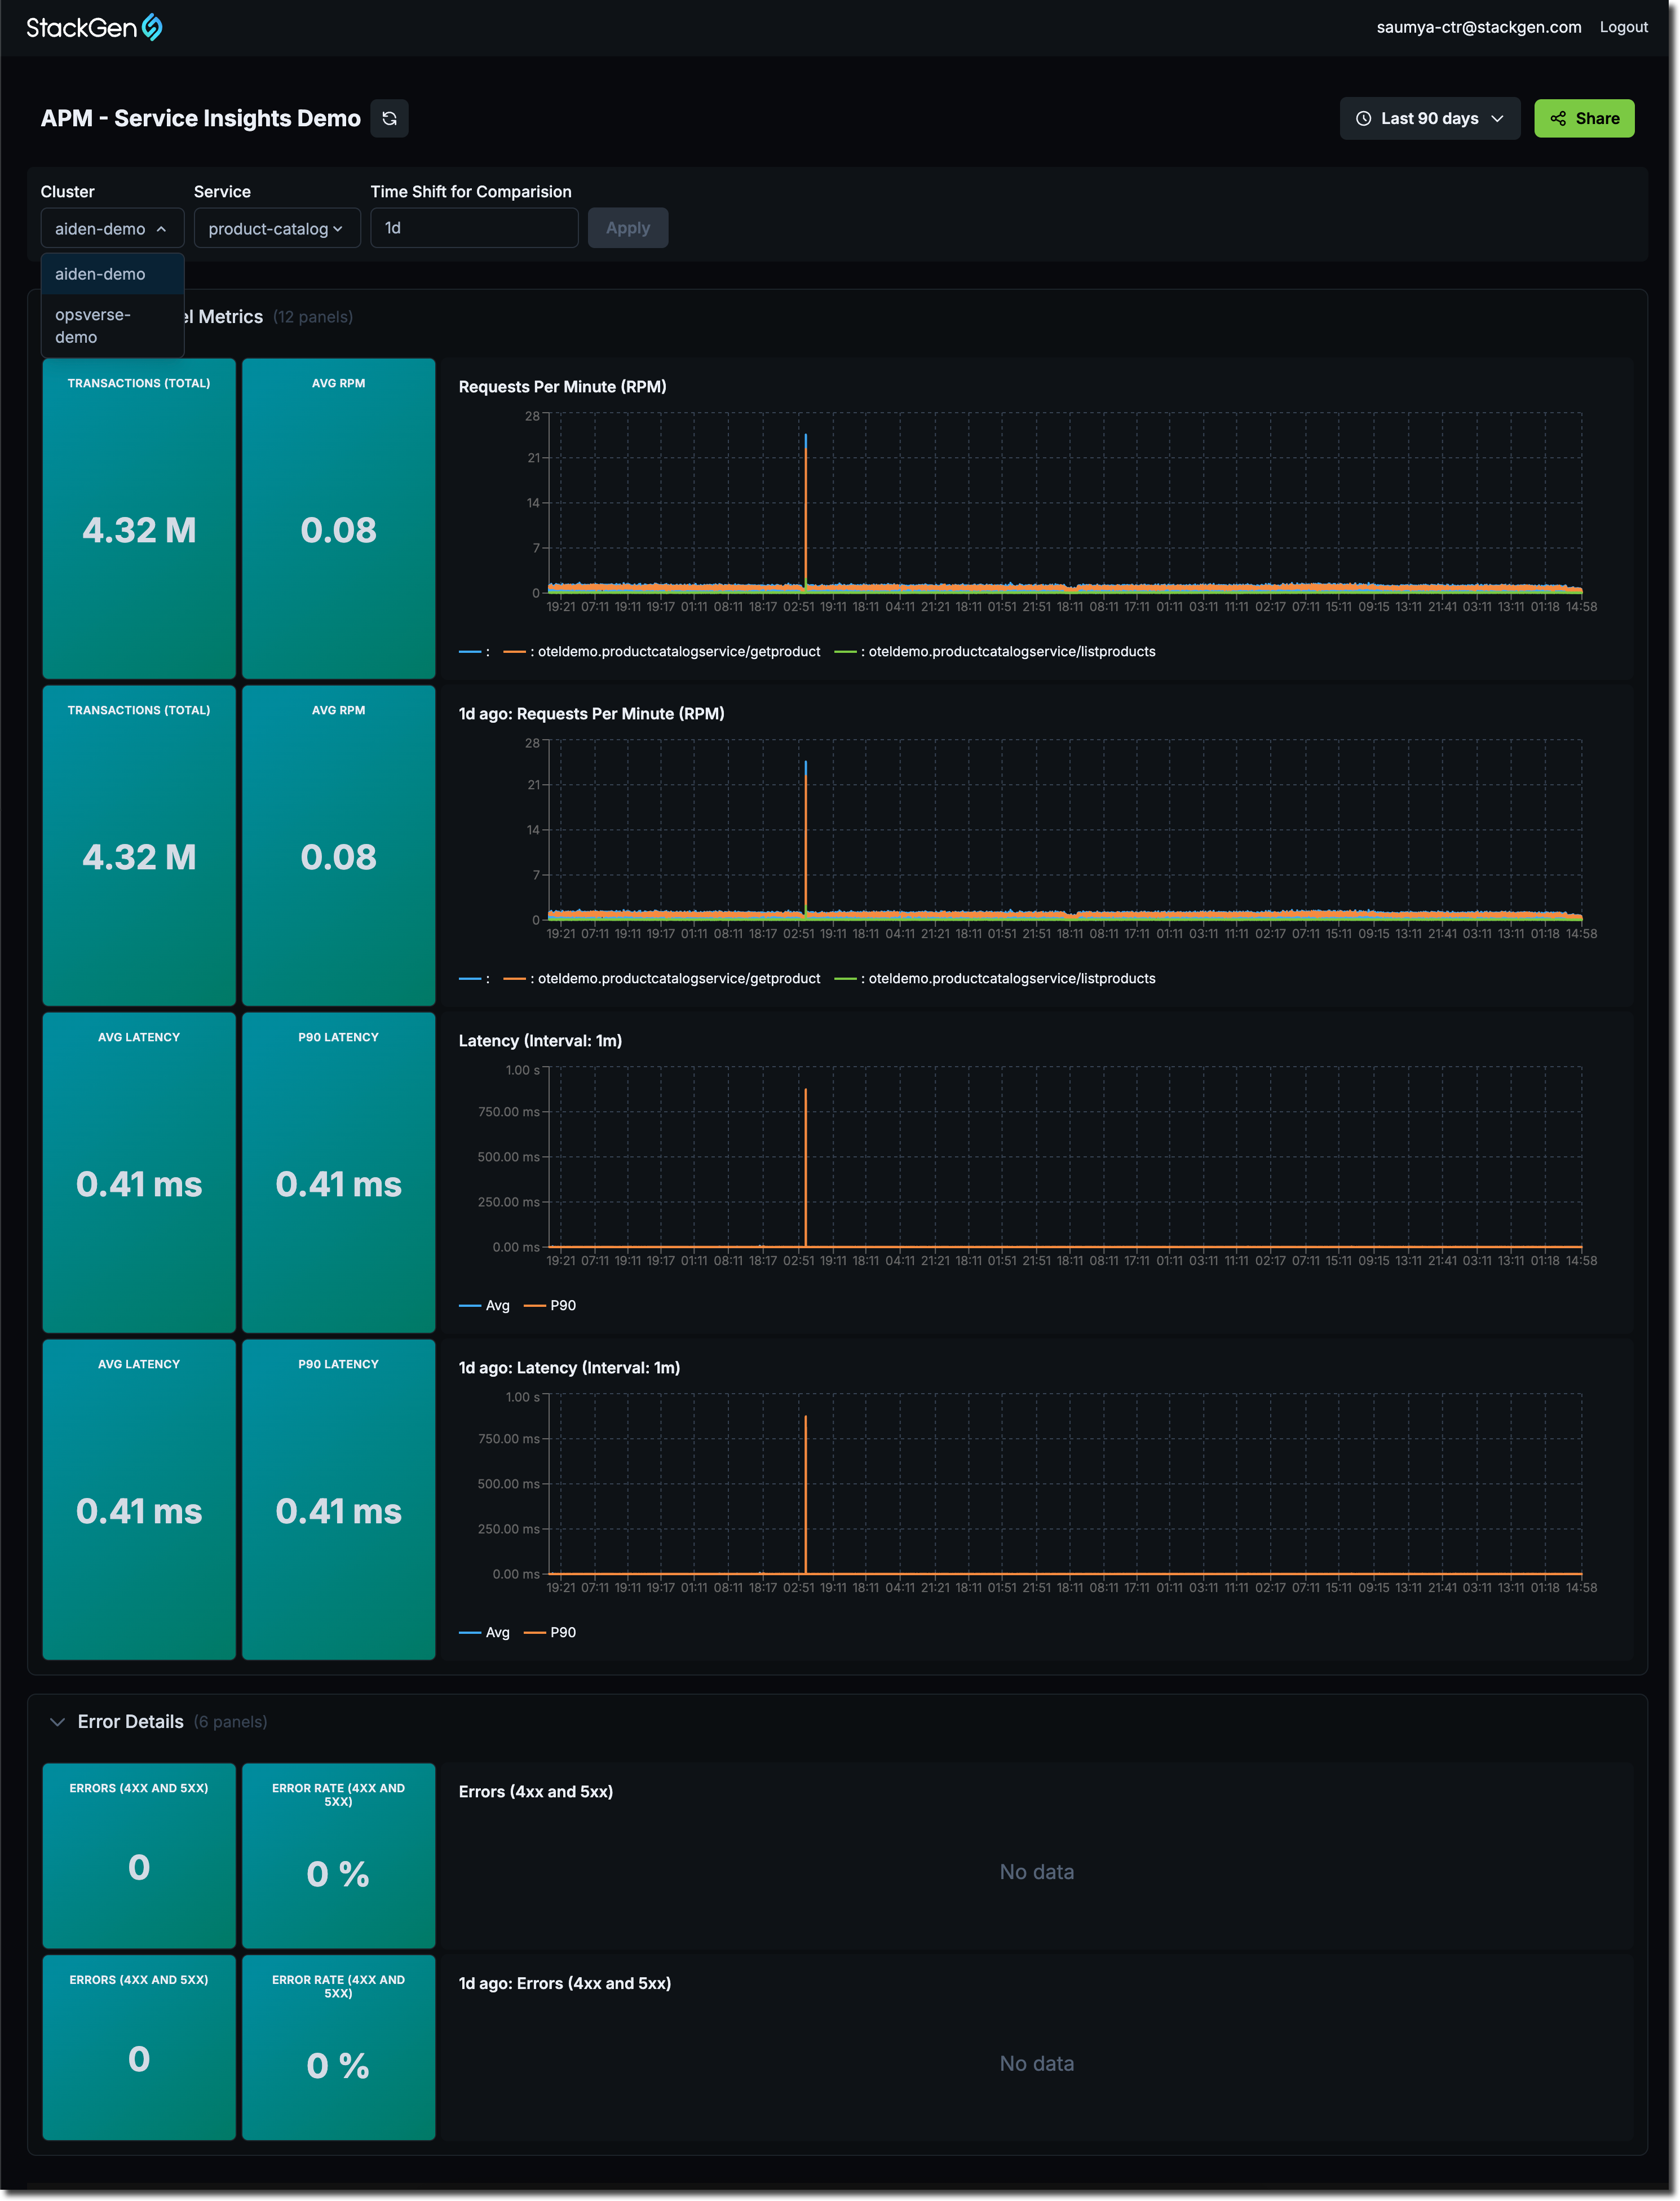
Set filters or the Grafana dashboard variables (for example, pick a specific customer, region, or service.)
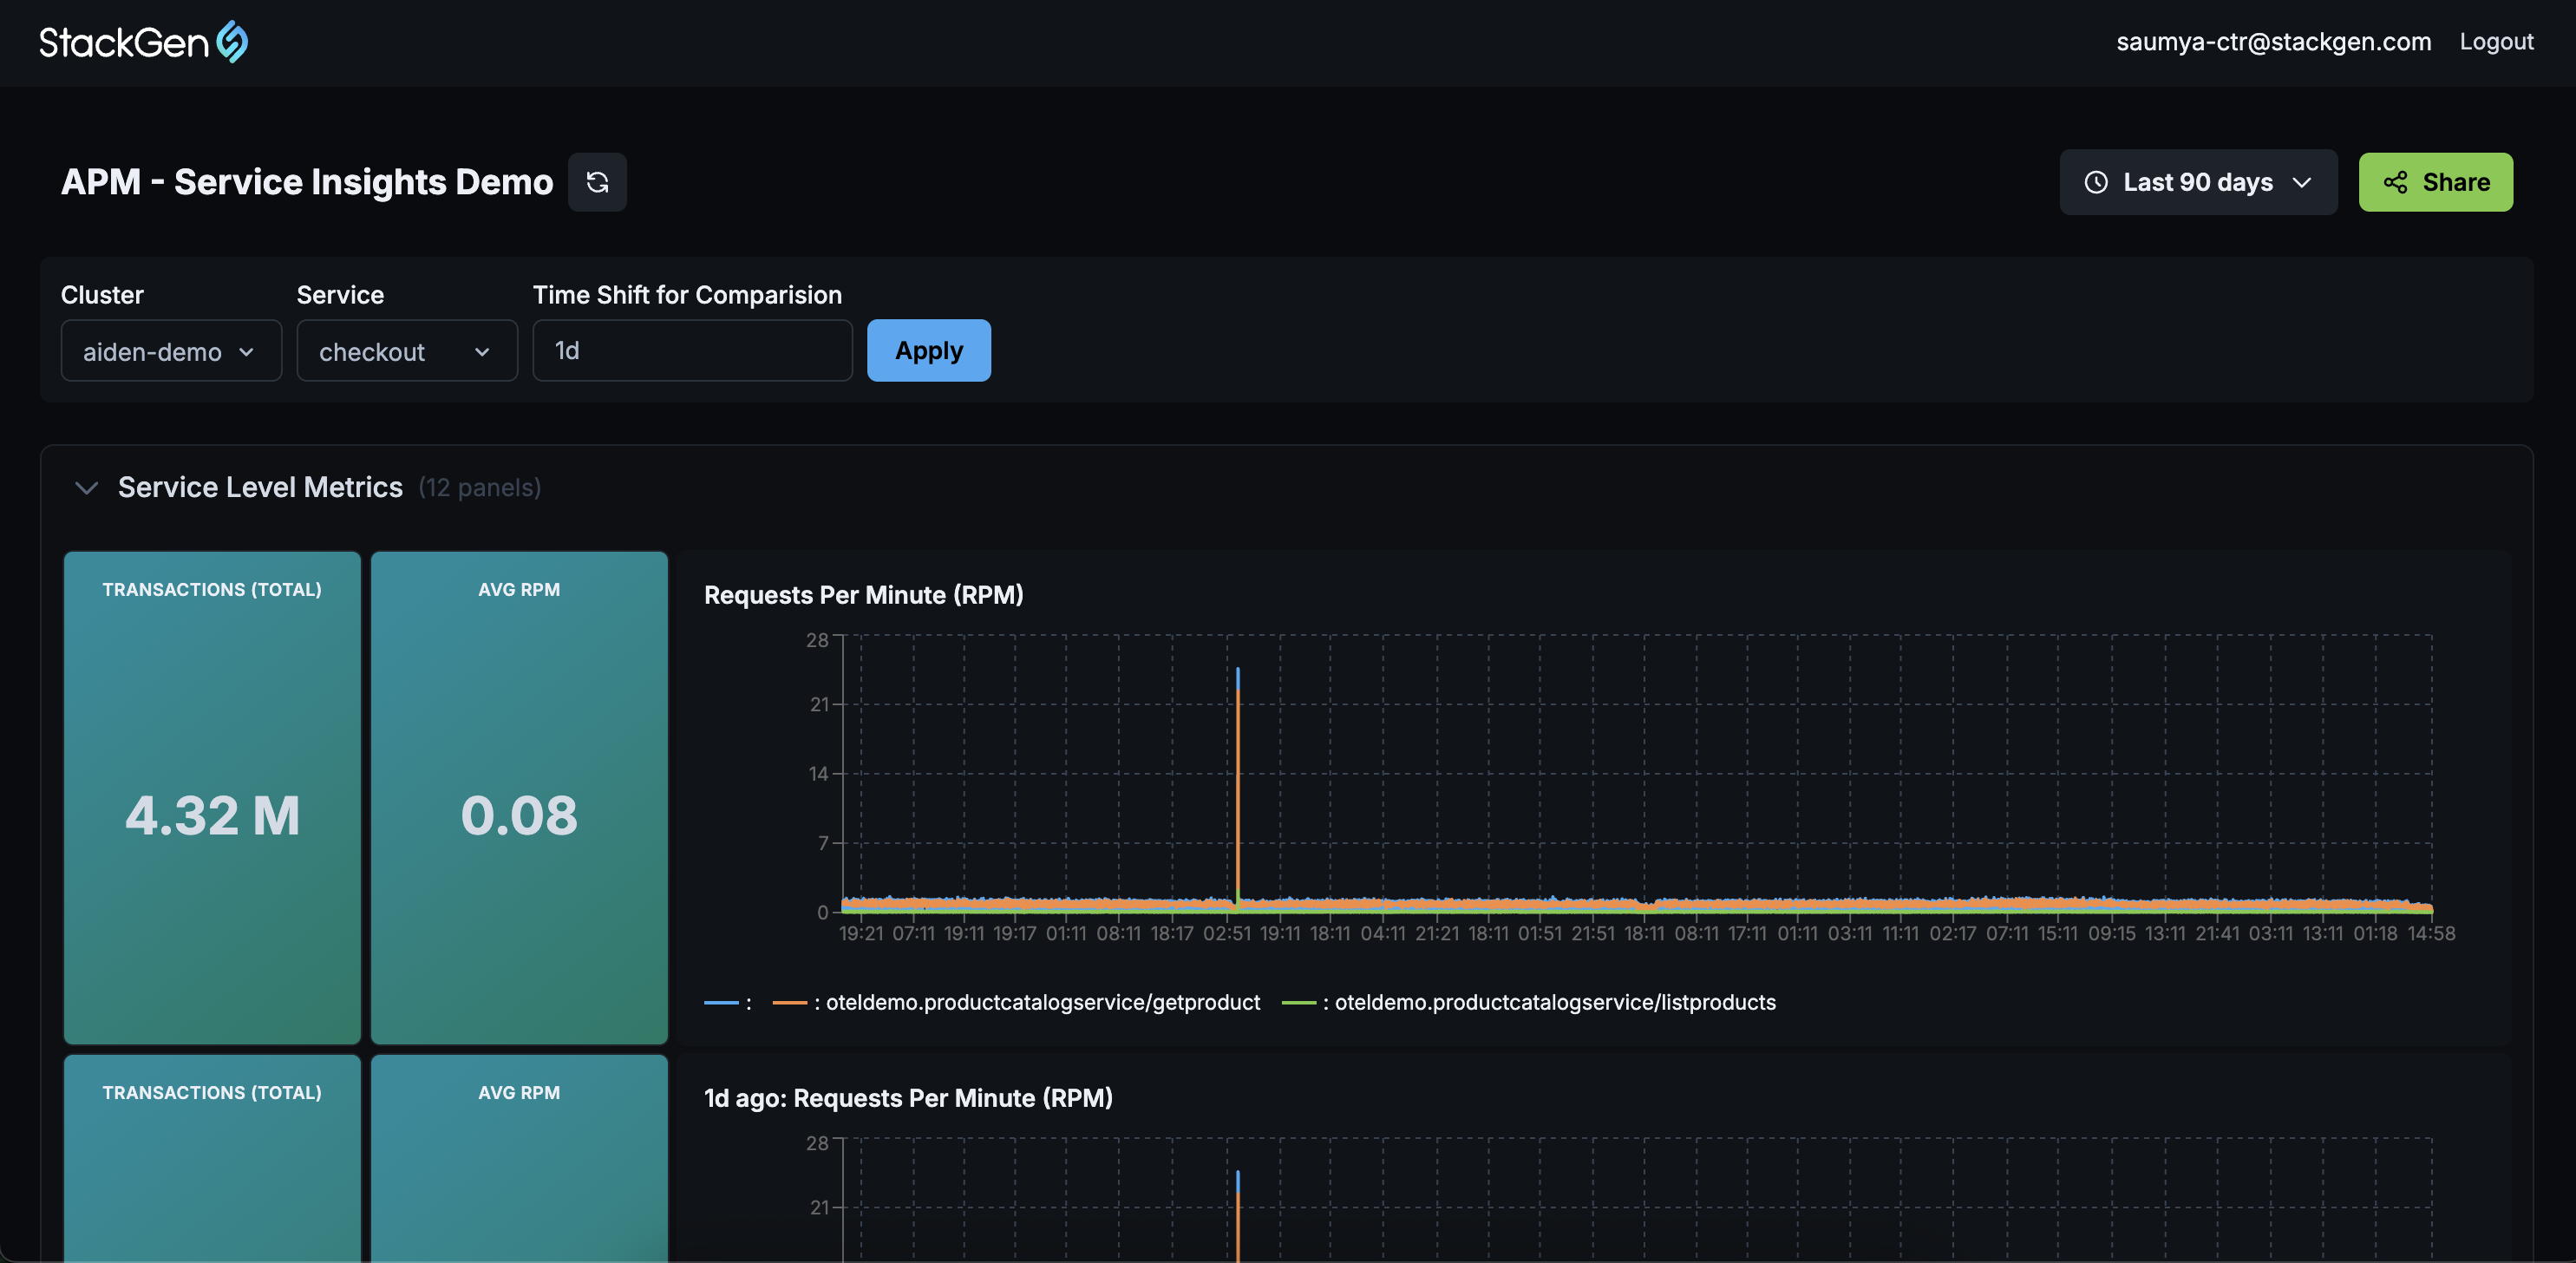
-
Click Apply so the view reflects those values.
tipVariables must be applied before you share a dashboard. Doing so, enforces customer specific access and your recipients see only the filtered dataset you configured. Recipients cannot change those filters in their view except for the Time Range.
Share the Dashboard
Once you've scoped your dashboard and applied changes, follow these steps:
-
Click Share.
-
Enter one or more recipient email addresses.
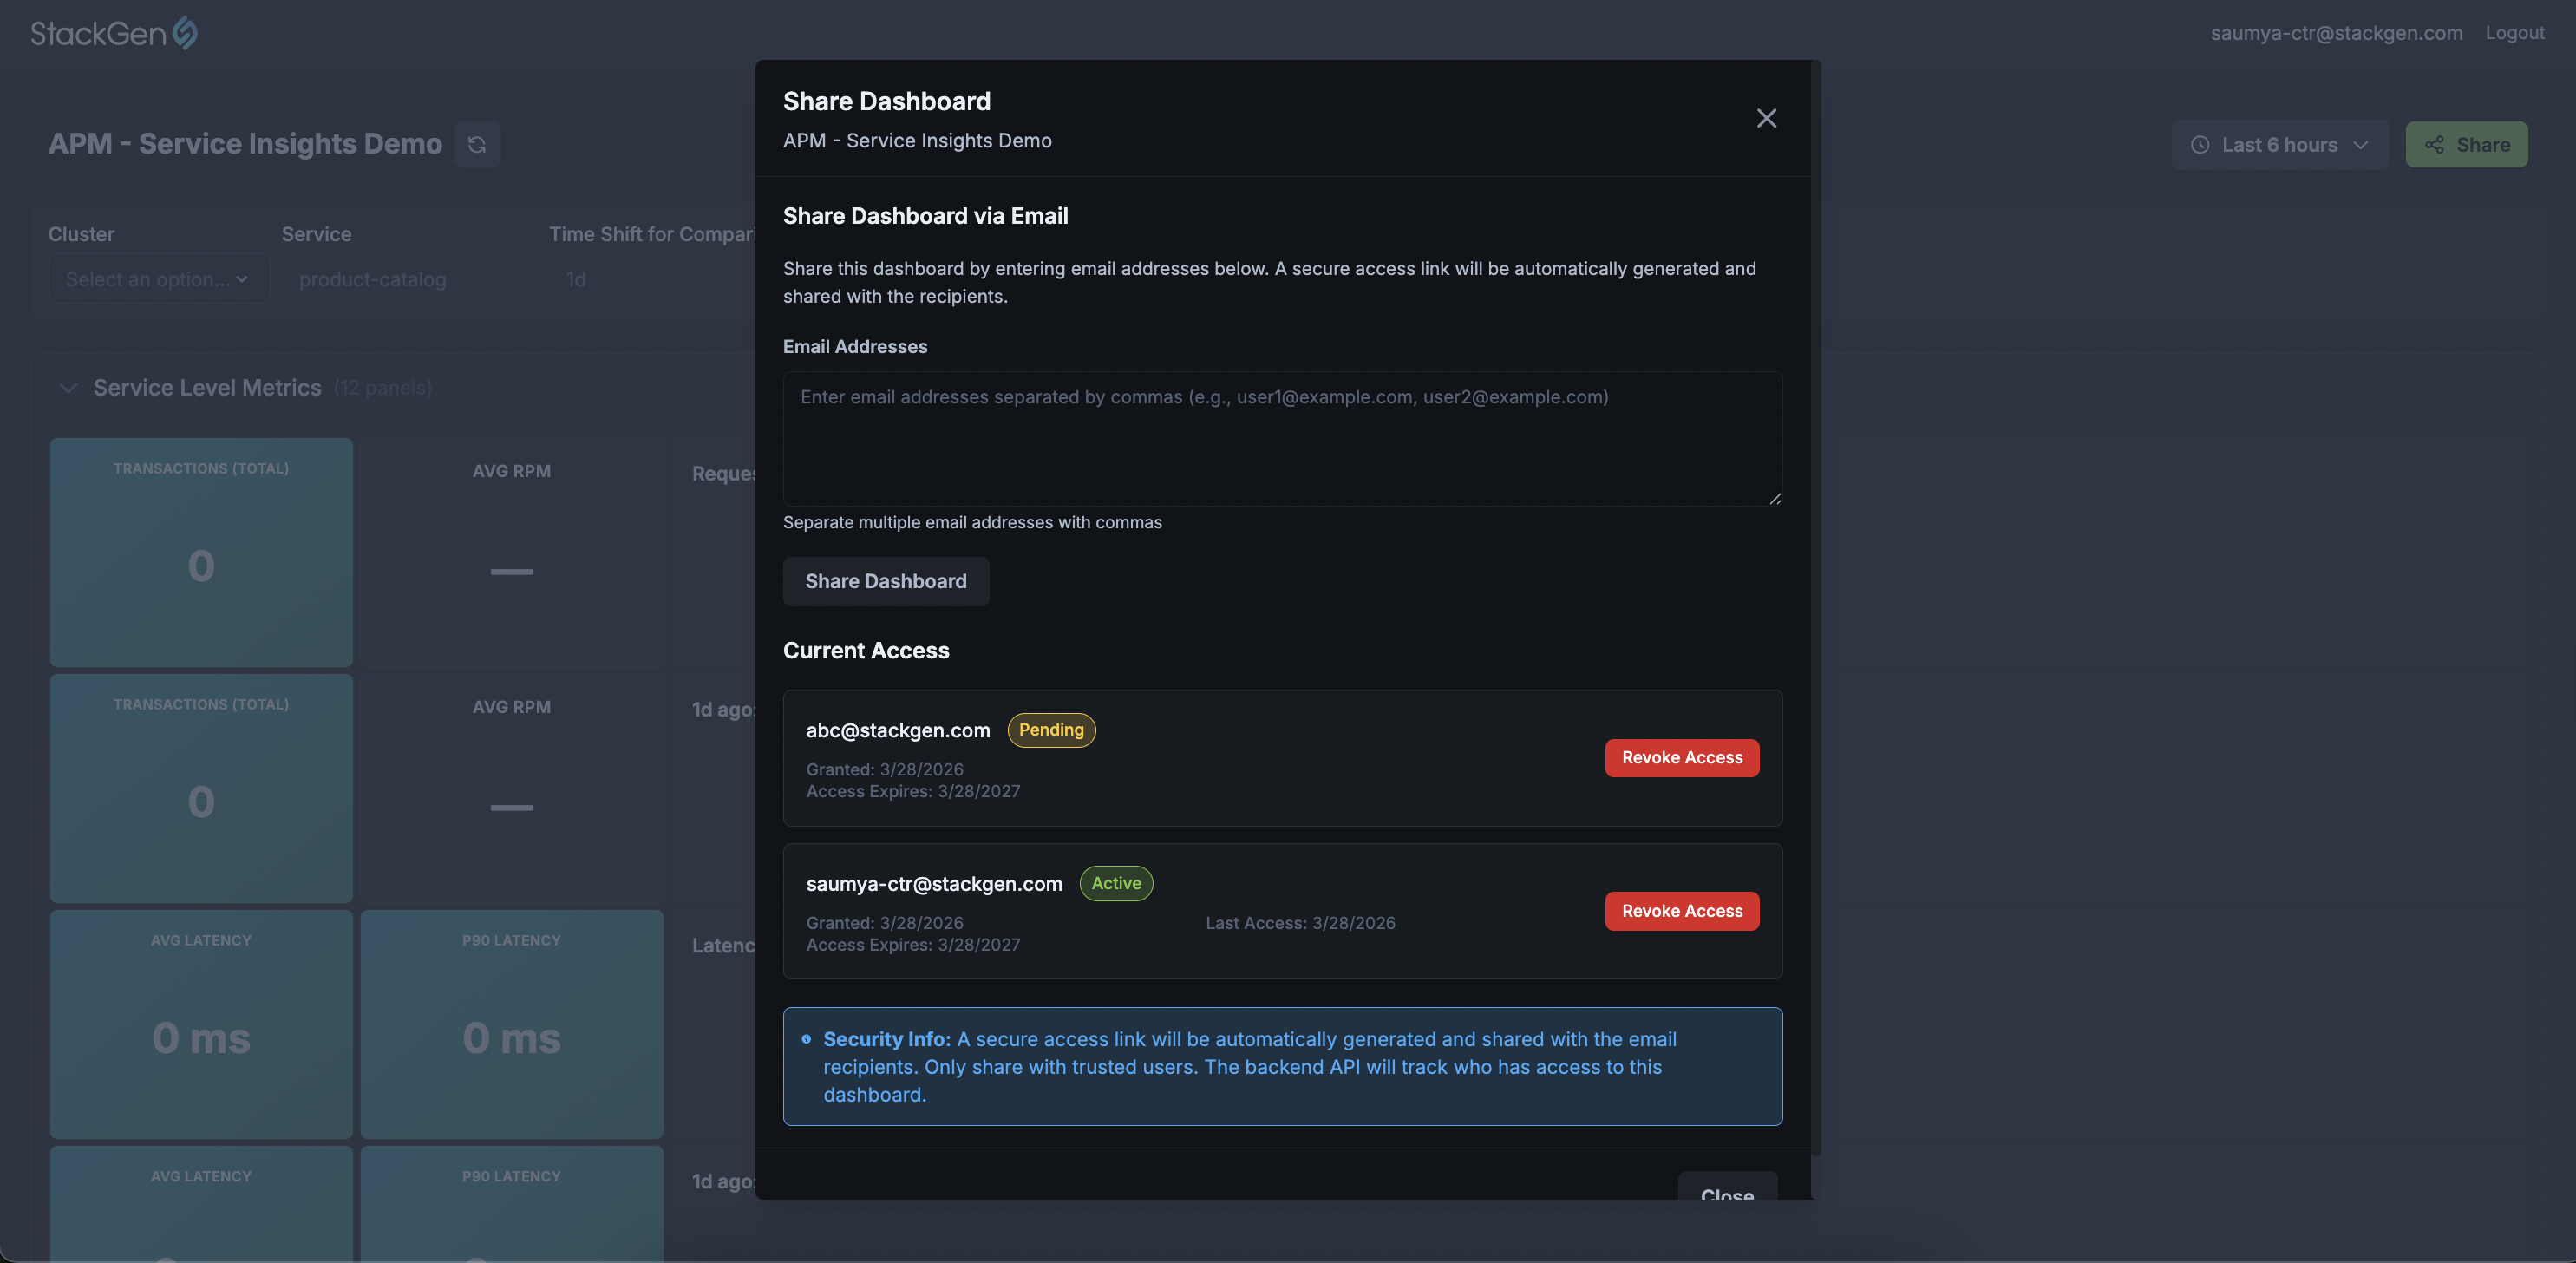
-
Click Share Dashboard.
What Happens After you Share the Dashboard
Once you share a dashboard with the customer:
- Recipients get an email with a one-time secure access link and the dashboard name. Once they click open the dashboard, the access will be stored in their browser cache and they can access the dashboard for a year. You can always revoke their access and share the dashboard again with the customer keeping in line with the security best practices.
- Access Link Behaviour: The secure link follows a controlled lifecycle:
- Invite link: Valid for 30 days
- Can be used once to initiate access.
- After first use: Access continues via the browser session
- Default access duration: up to a year
- If link expires:
- You must share the dashboard again
- If access is revoked
- Access stops immediately
- Invite link: Valid for 30 days
- Access Link Behaviour: The secure link follows a controlled lifecycle:
- In the product, each invitee appears with a status:
- Pending: they have not opened the link yet.
- Active: they have accessed the dashboard and can use the session according to your access model.
Delete a Dashboard
Click to view
Deleting a dashboard removes the customer dashboard from Shared Dashboards and revokes access for all recipients at once. To offer that view again, re-import from Grafana and go through Create a Dashboard and Scope and Share the Dashboard.
Follow these steps:
-
Sign in to your Shared Dashboards URL (same host you use for Create a Dashboard).
-
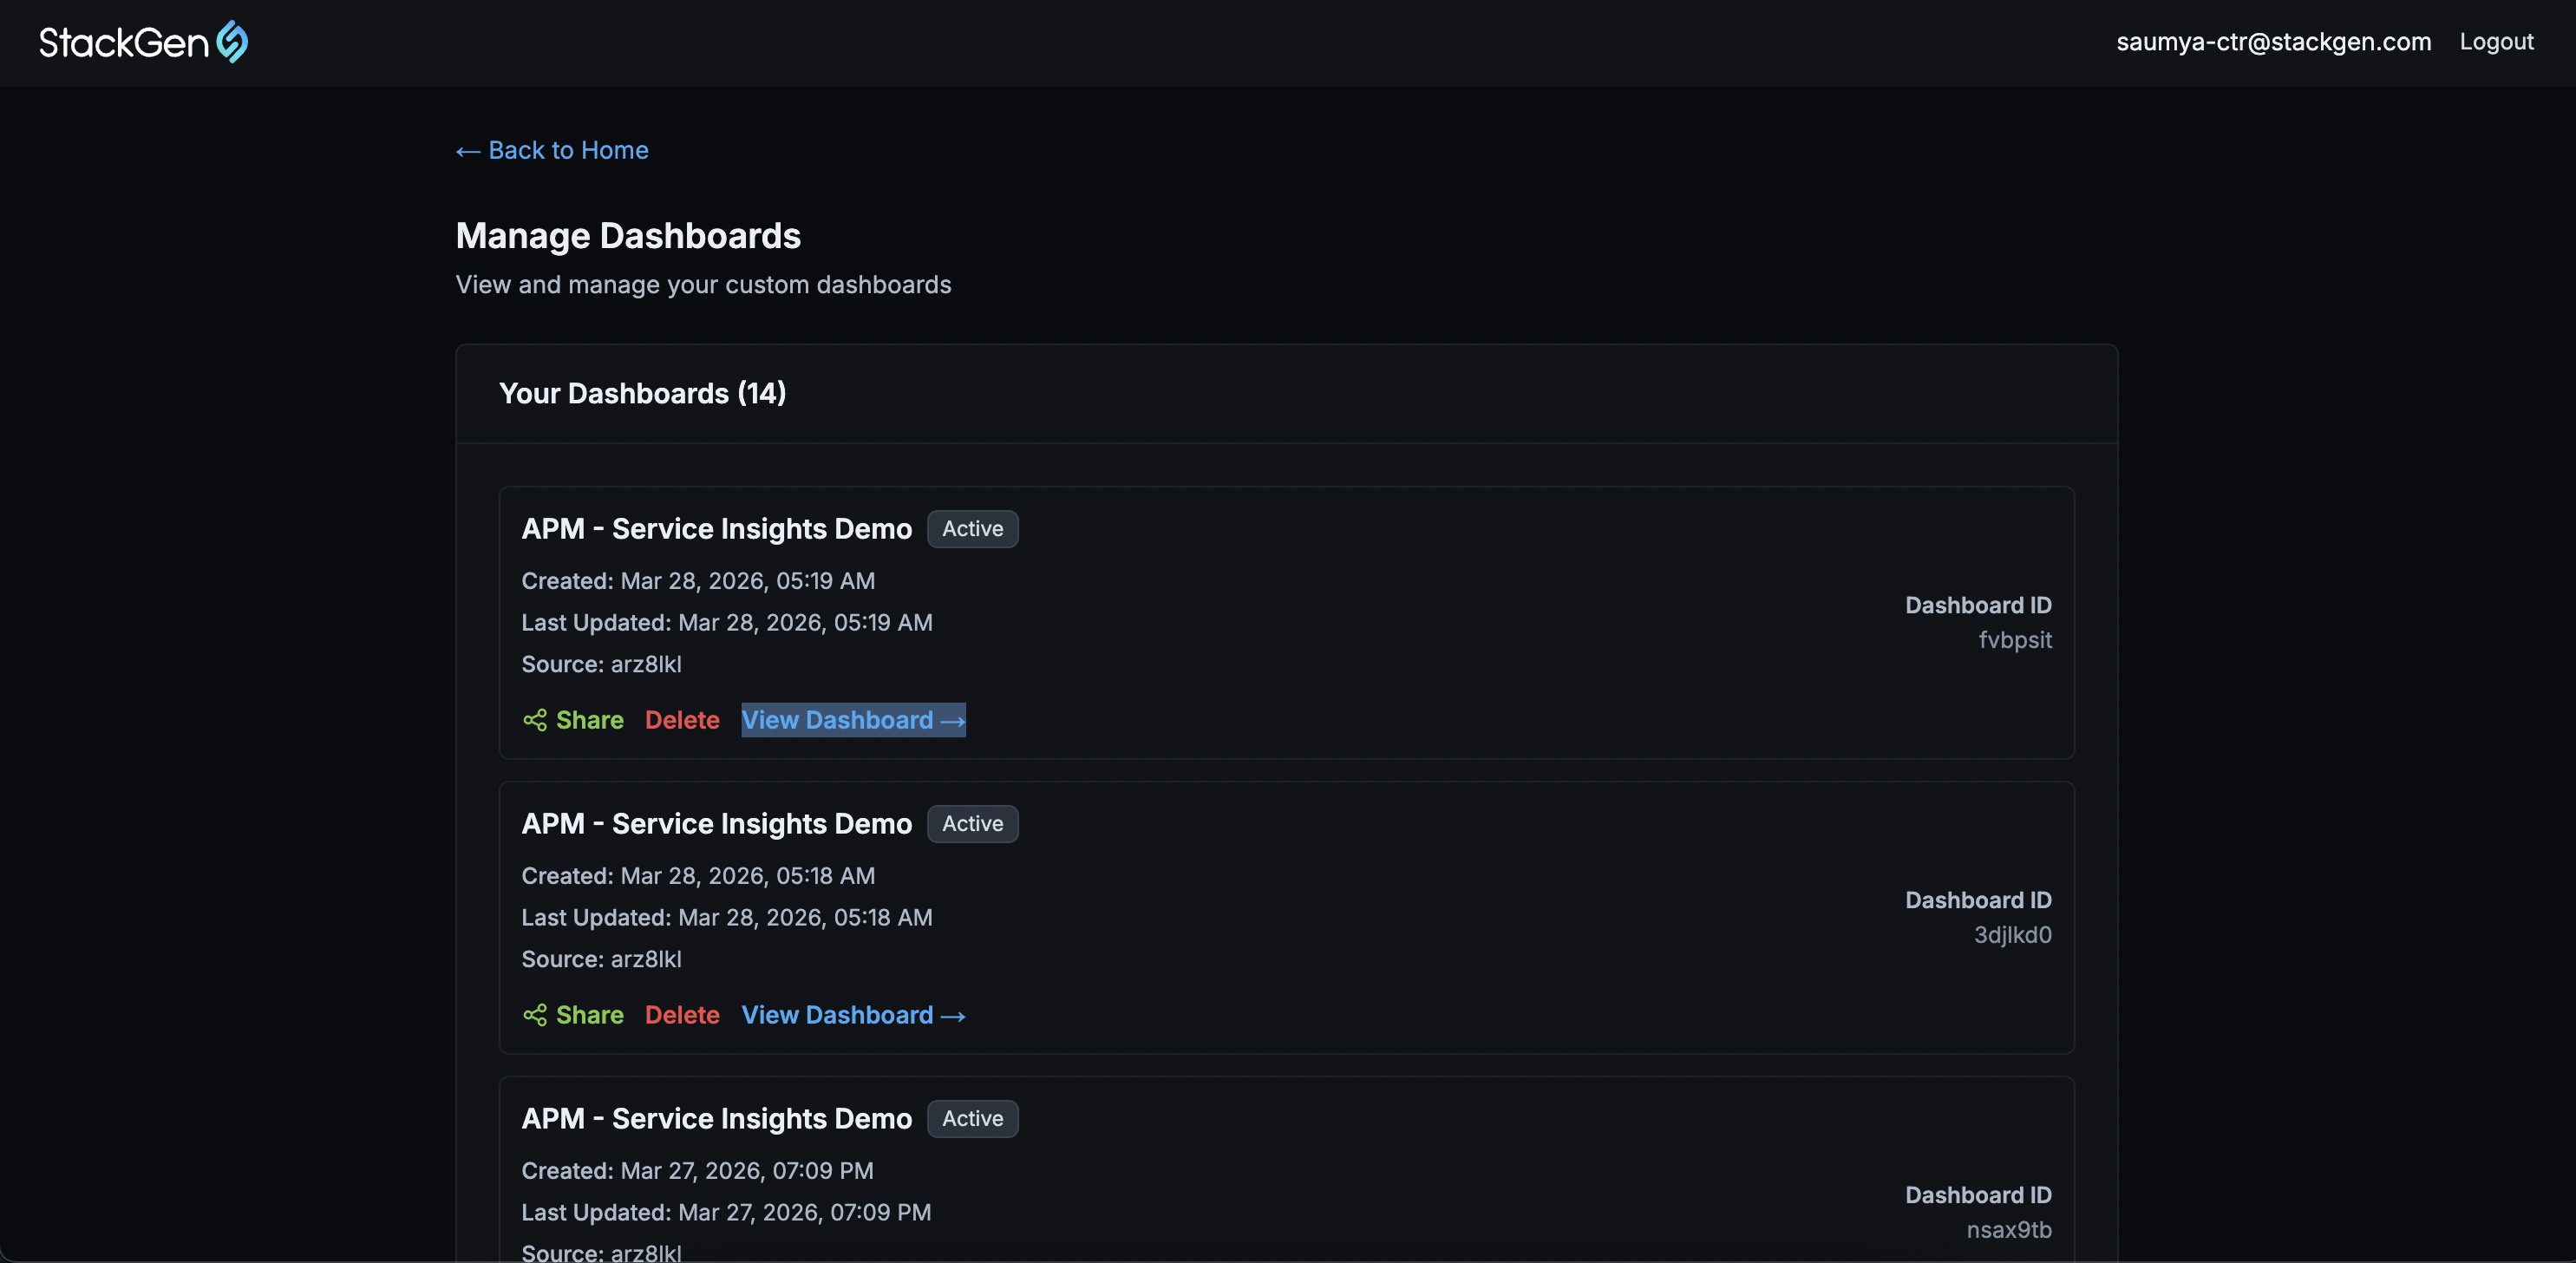
From the Dashboard Management page, click Manage Dashboards.
-
From Your Dashboards, find the card for the dashboard you want to delete.
-
Click Delete and confirm. This action is destructive.
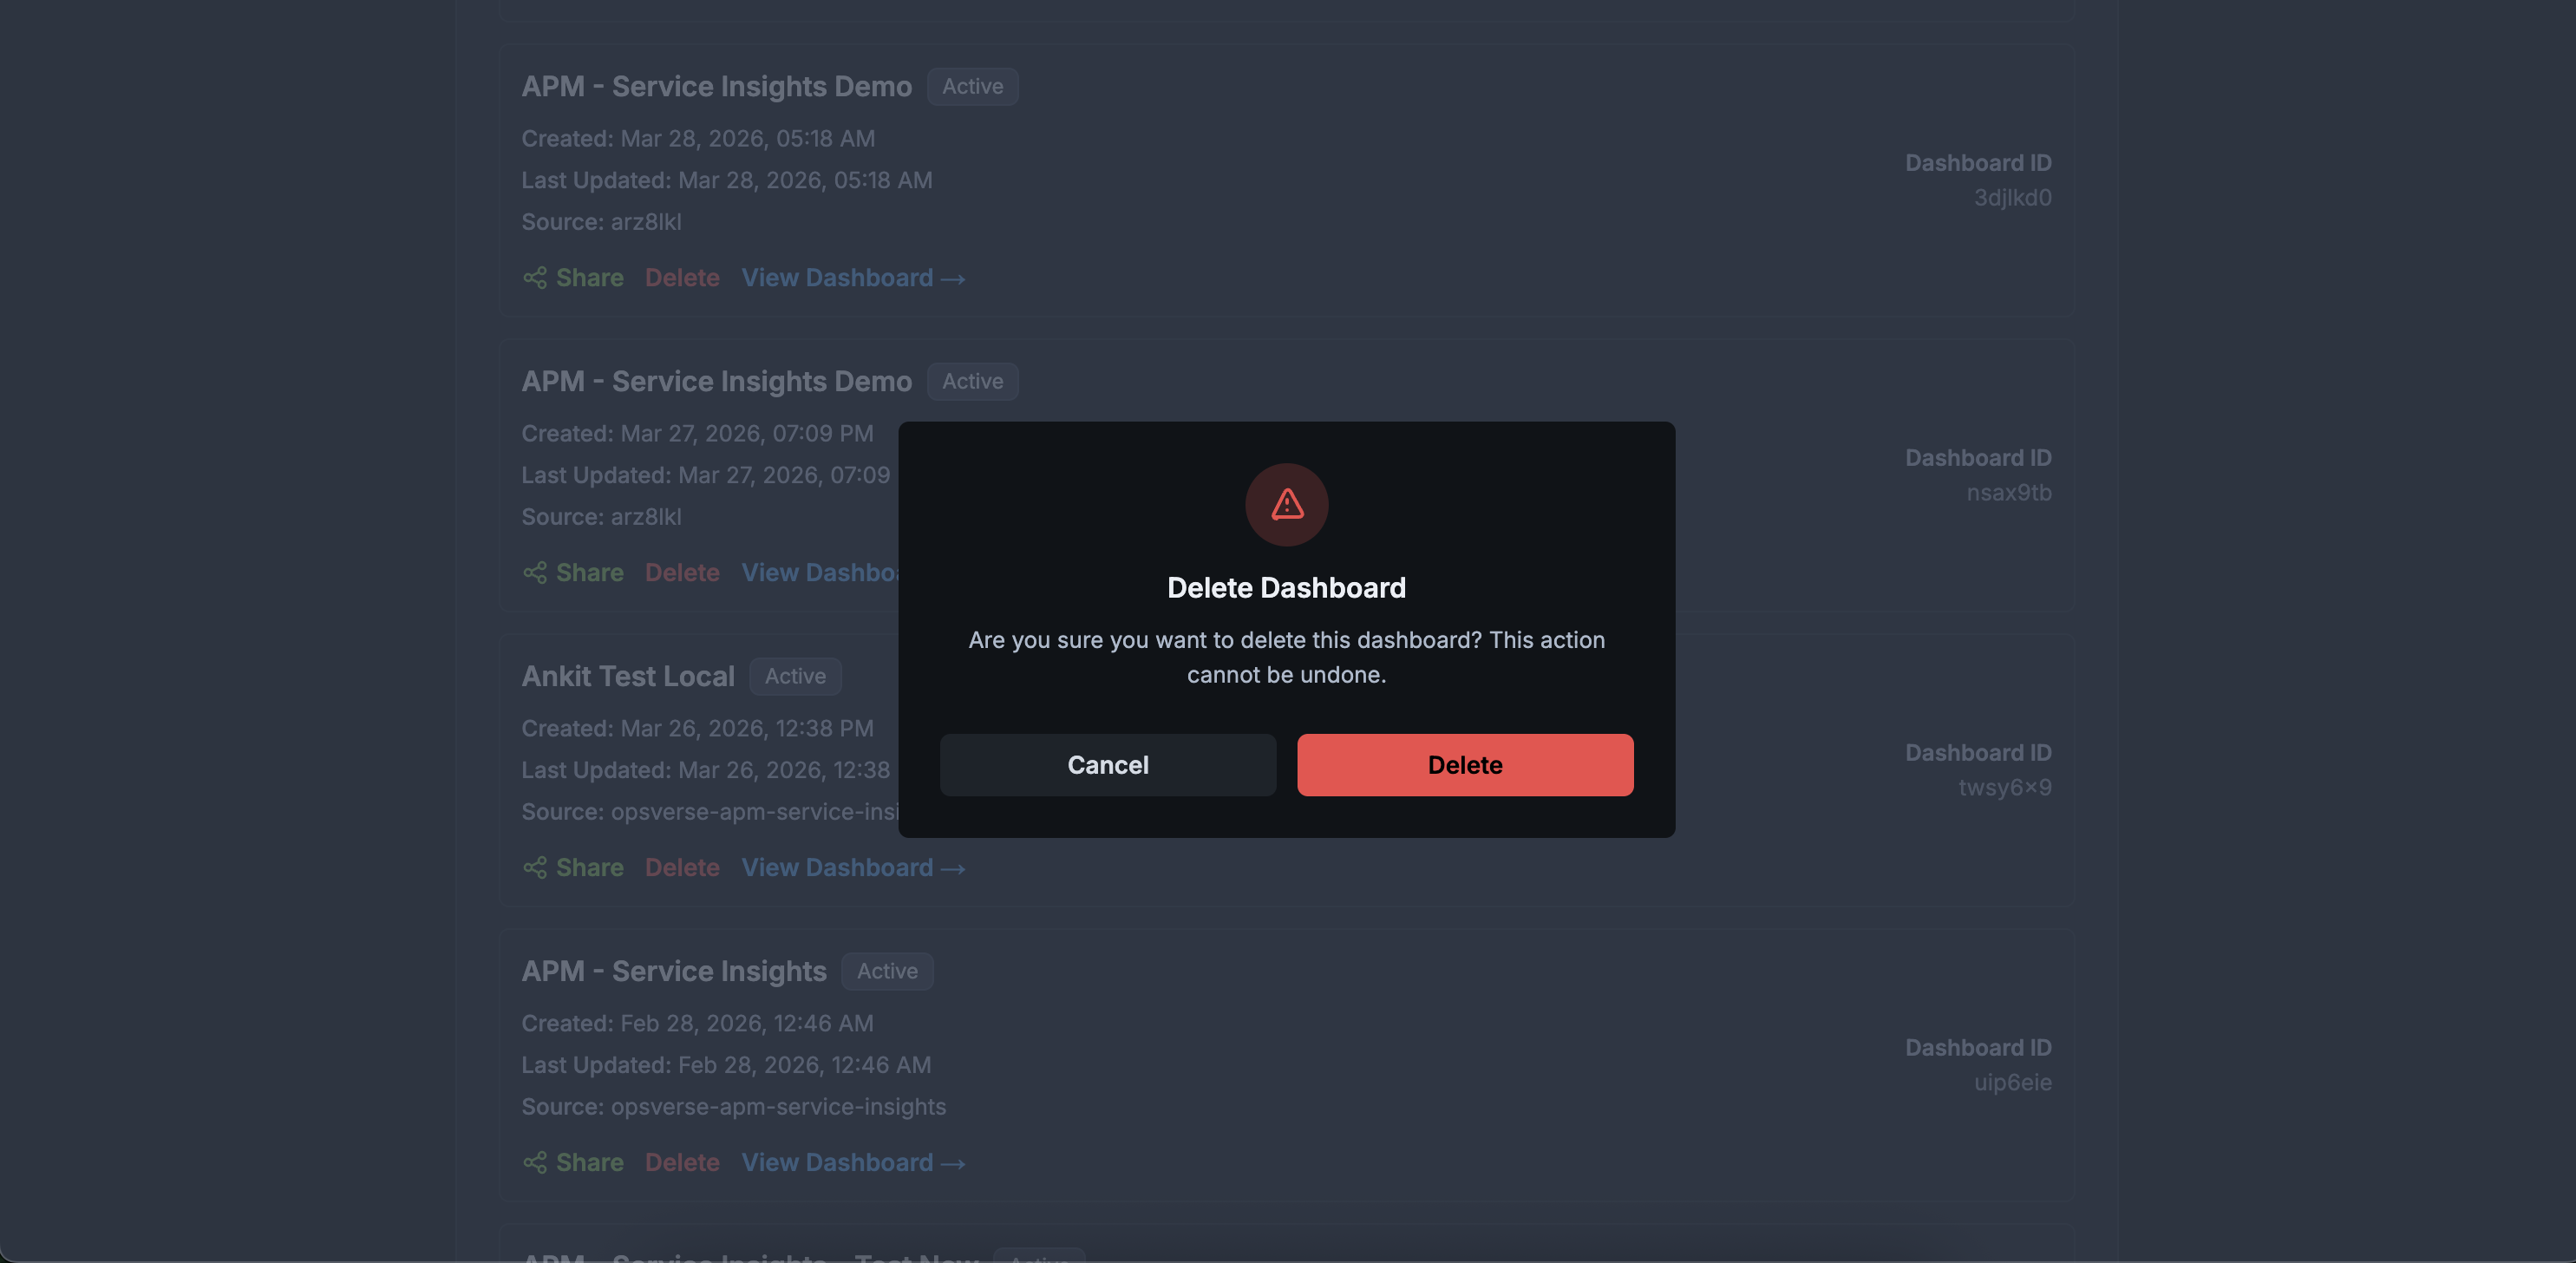
Delete removes the dashboard for everyone and invalidates invite links. To remove one recipient only, open Share for that dashboard and Revoke user access instead. For what each row action does, see Manage Dashboards.
When to use
- Prevent cross-customer data exposure when you retire a shared view.
- You can shut down a whole dashboard without managing recipients one by one.
- Control how long a dashboard is available.
For the Manage Dashboards list (metadata, Share, Delete, View Dashboard →), see Manage Dashboards.