.NET / .NET Framework
Overview
This documentation will show you how to instrument your .NET applications to send OpenTelemetry traces to ObserveNow.
Setup
For apps running on .NET Auto Instrumentation
Install the following packages using dotnet add package command:
- OpenTelemetry.Exporter.Console: (Optional: For traces to be displayed on Console during development)
- OpenTelemetry.Exporter.OpenTelemetryProtocol
- OpenTelemetry.Extensions.Hosting
- OpenTelemetry.Instrumentation.AspNetCore
In the *.csproj file, the installed packages will look like:
...
  <ItemGroup>
    ...
    <PackageReference Include="OpenTelemetry.Exporter.Console" Version="1.7.0" />
    <PackageReference Include="OpenTelemetry.Exporter.OpenTelemetryProtocol" Version="1.7.0" />
    <PackageReference Include="OpenTelemetry.Extensions.Hosting" Version="1.7.0" />
    <PackageReference Include="OpenTelemetry.Instrumentation.AspNetCore" Version="1.7.0" />
    ...
  </ItemGroup>
...
Configuration
Paste the below code snippet in the Program.cs file
// Import necessary packages
using System.Diagnostics;
using OpenTelemetry.Exporter;
using OpenTelemetry.Resources;
using OpenTelemetry.Trace;
using OpenTelemetry.Exporter.OpenTelemetryProtocol;

...

// Configure OpenTelemetry settings
var builder = WebApplication.CreateBuilder(args);

builder.Services.AddOpenTelemetry()
    .ConfigureResource(resource => resource.AddService("<service_name>"))
    .WithTracing(tracing =>
    {
        tracing.AddAspNetCoreInstrumentation();
        // tracing.AddConsoleExporter(); (Used only for development purposes)
        tracing.AddOtlpExporter(opt =>
        {
            opt.Endpoint = new Uri("<otel_collector_endpoint>");
            opt.Protocol = OpenTelemetry.Exporter.OtlpExportProtocol.Grpc;
        });
    });

var app = builder.Build();

...
For apps running on .NET Framework 4.8.x Instrumentation - Manual
Install the following packages using dotnet add package command or NuGet package manager:
- OpenTelemetry
- OpenTelemetry.Exporter.OpenTelemetryProtocol
- OpenTelemetry.Instrumentation.HTTP
- OpenTelemetry.Instrumentation.AspNetCore
- OpenTelemetry.Exporter.Console (Optional: For traces to be displayed on Console during development)
In the *.csproj file, the installed packages will look like:
...
  <ItemGroup>
    ...
    <PackageReference Include="OpenTelemetry" Version="1.7.0" />
    <PackageReference Include="OpenTelemetry.Exporter.Console" Version="1.7.0" />
    <PackageReference Include="OpenTelemetry.Exporter.OpenTelemetryProtocol" Version="1.7.0" />
    <PackageReference Include="OpenTelemetry.Instrumentation.AspNetCore" Version="1.7.0" />
    <PackageReference Include="OpenTelemetry.Instrumentation.HTTP" Version="1.7.0" />
    ...
  </ItemGroup>
...
Configuration
Paste the below code snippet in the Program.cs file
// Import necessary packages
using System.Diagnostics;
using Microsoft.Extensions.Configuration;
using OpenTelemetry;
using OpenTelemetry.Exporter;
using OpenTelemetry.Trace;
using System;
using System.Net.Http.Headers;
using System.Net.Http;
using System.Threading.Tasks;
using OpenTelemetry.Resources;

...

public class Program
{
    ...
    private static readonly ActivitySource MyActivitySource = new ActivitySource("MyCompany.MyProduct.MyLibrary");

    public static void Main()
    {
        var tracerProvider = Sdk.CreateTracerProviderBuilder()
            .SetResourceBuilder(ResourceBuilder.CreateDefault().AddService("<service_name>"))
            // The following subscribes to activities from Activity Source MyCompany.MyProduct.MyLibrary
            .AddSource("MyCompany.MyProduct.MyLibrary")
            // .AddConsoleExporter() (Used only for development purposes)
            .AddOtlpExporter(opt =>
            {
                opt.Endpoint = new Uri("<otel_collector_endpoint>");
                opt.Protocol = OtlpExportProtocol.Grpc;
            })
            .Build();

        // You can also set custom tags to the trace information
        // NOTE: This is used for testing and can be deleted once testing is done.
        using (var activity = MyActivitySource.StartActivity("<activity_name>"))
        {
            activity?.SetTag("foo", 1);
            activity?.SetTag("bar", "Hello, World!");
            activity?.SetTag("baz", new int[] { 1, 2, 3 });
            activity?.SetStatus(ActivityStatusCode.Ok);
        }

        // Dispose tracer provider before the application ends.
        // This will flush the remaining spans and shutdown the tracing pipeline.
        tracerProvider.Dispose();
    }
    ...
}
Every activity source which produce telemetry must be explicitly added to the tracer provider to start collecting traces from them. AddSource method on TracerProviderBuilder can be used to add a ActivitySource to the provider. The name of the ActivitySource (case-insensitive) must be the argument to this method.
Ensure that the StackGen Agent otel-collector is accessible from your .NET application environnment, either using an ingress or an IP
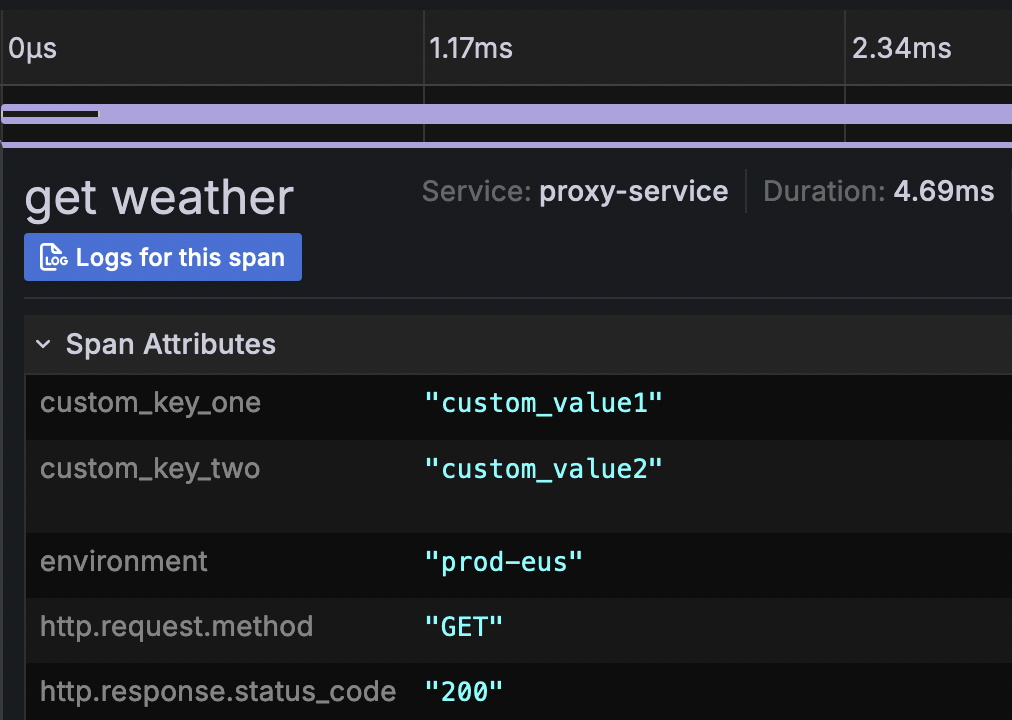
Adding Custom Span Attributes
Custom span attributes can be added at the service level or at (more granular) trace level. For service level span attributes, you can configure an environment variable OTEL_RESOURCE_ATTRIBUTES with key value pairs. For eg.
OTEL_RESOURCE_ATTRIBUTES=key1=value1,key2=value2
These will be picked up by the OpenTelemetry SDK and be brought into traces in your ObserveNow Instance.
For granular, trace level attributes, you can leverage ActivitySource to add custom span attributes. This is somewhat similar to the [manual instrumentation](_NET _ _NET Framework#6rkb4) steps above:
using System.Diagnostics;
.
.
  [HttpGet]
  public IActionResult Get()
  {
    var activitySource = new ActivitySource("MyCompany.MyProduct.MyLibrary");
    using (var activity = activitySource.StartActivity("<activity_name>"))
    {
       activity?.SetTag("<custom_attr_key>", "<custom_attr_value>");
       // Rest of your logic
    }
  }
.
.