Prometheus
Connect Aiden with your Prometheus monitoring system to get intelligent insights about your application metrics, system performance, and operational health. Once enabled, Aiden can analyze your metrics and help you understand your system's behavior through natural conversations.
Integration Capabilities
With Prometheus integration, Aiden can help you:
- Analyze real-time metrics and trends.
- Monitor service health and performance.
- Track resource utilization patterns.
- Investigate error rates and latencies.
- Compare metrics across different time periods.
- Debug performance issues.
- Create custom metric queries.
Enable Prometheus Integration
Follow these steps to enable the Integration:
-
From the Aiden home page, click Integrations from the navigation panel to the left.
-
Hover and click the Activate button on the Prometheus Integration card.
-
Enter the integration configuration parameters:
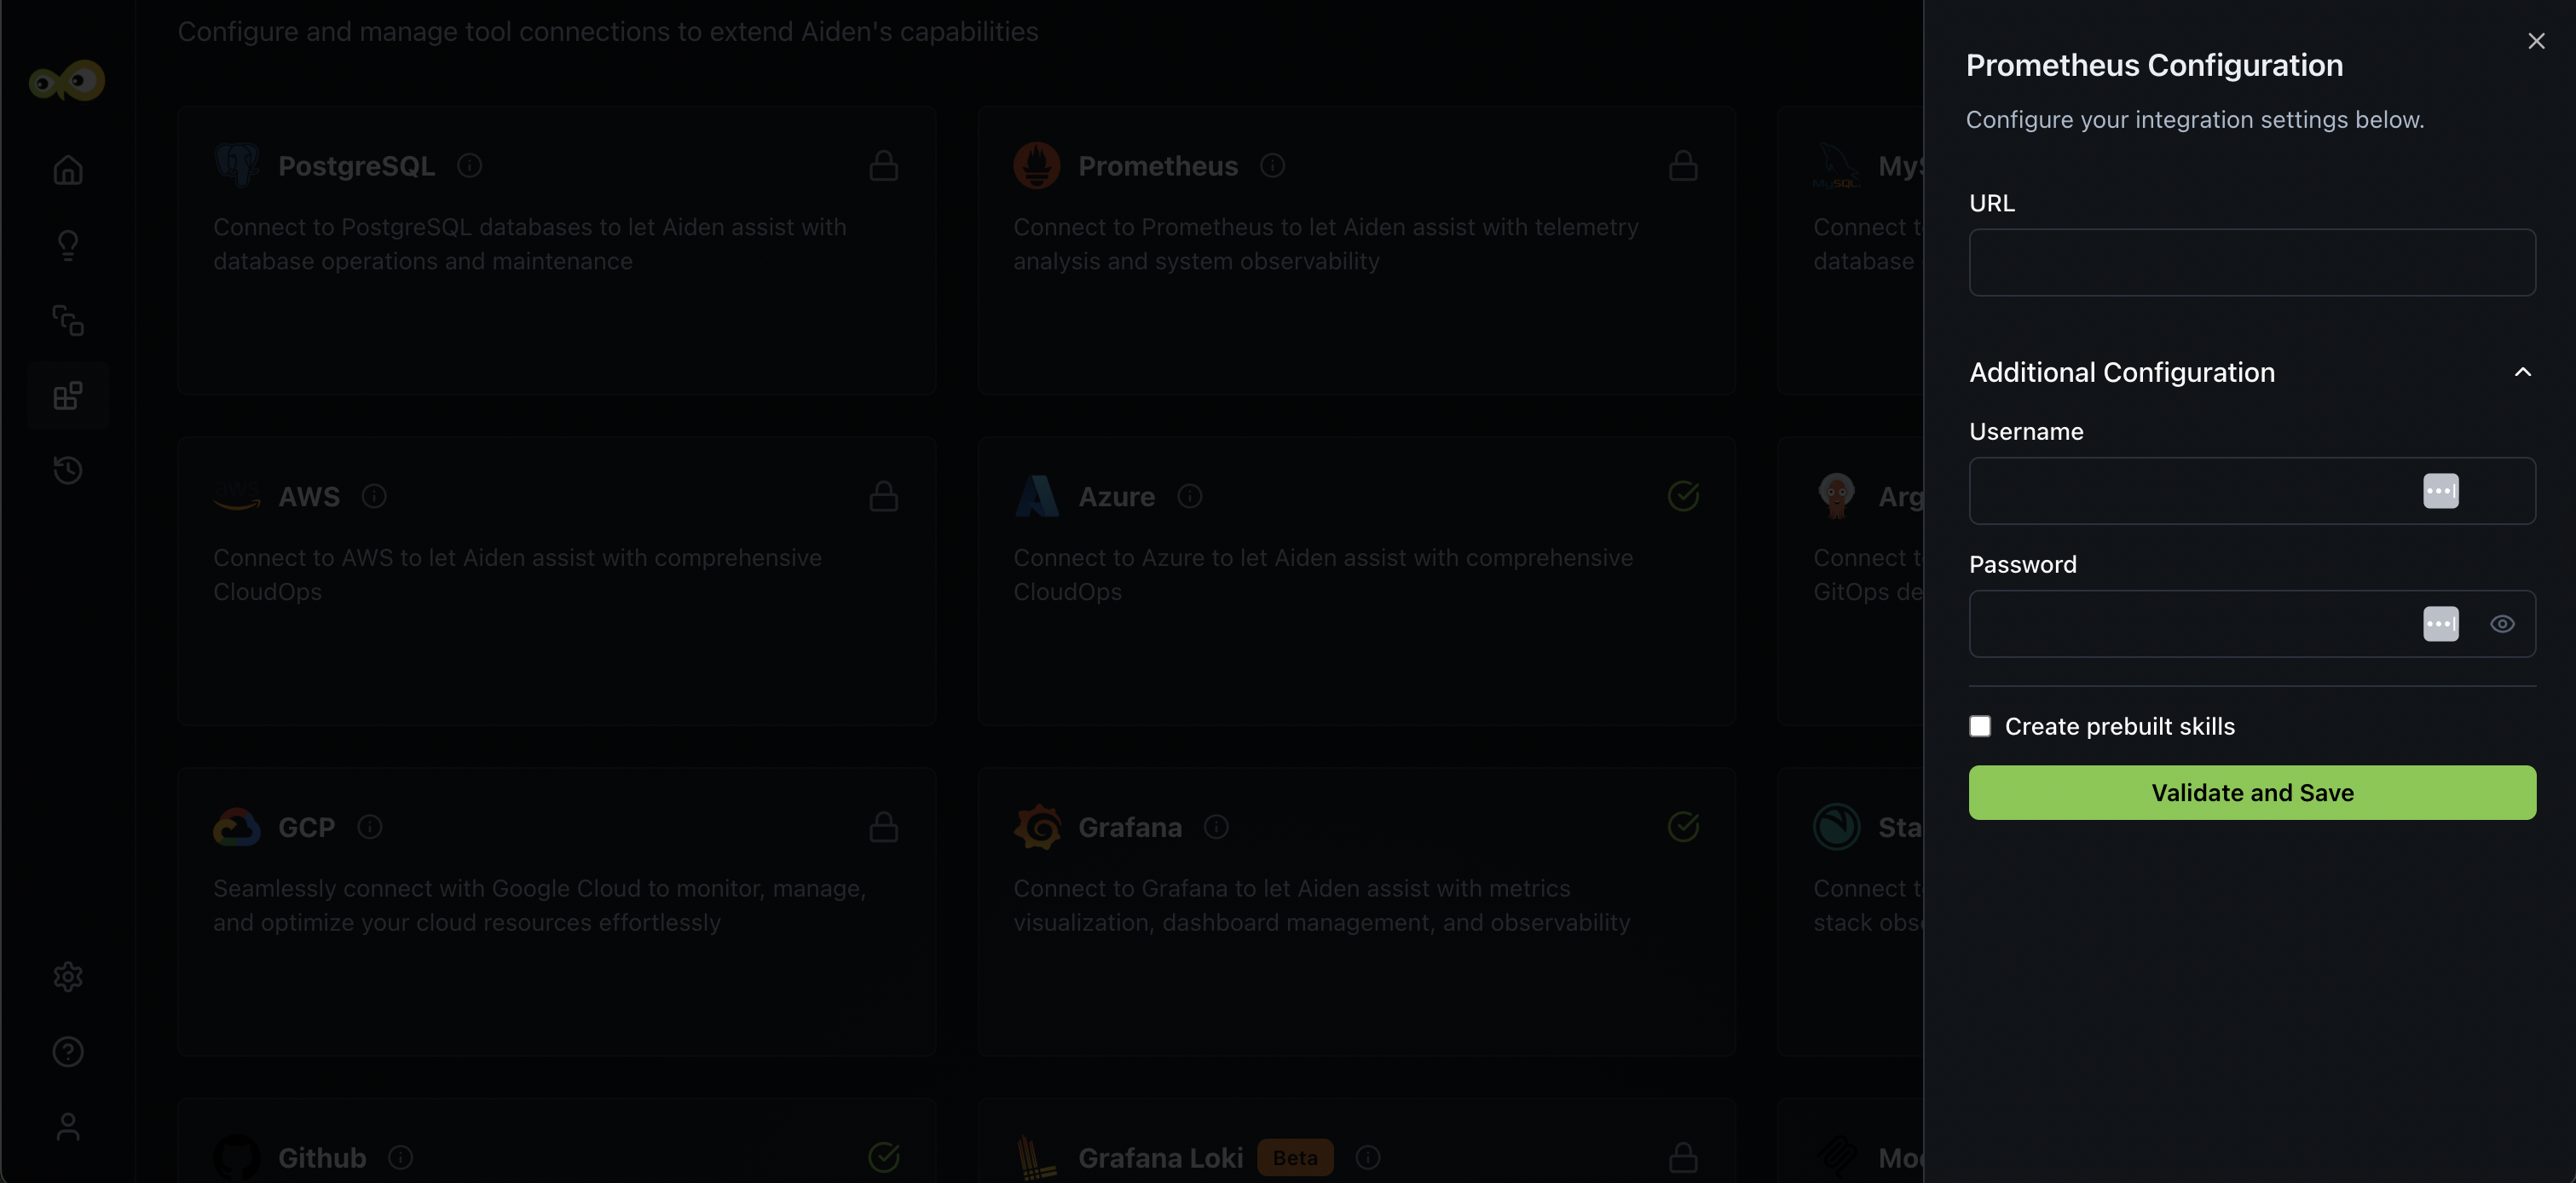
- URL: The web address (endpoint) of your Prometheus server.
- Additional Configurations:
note
If your Prometheus is public or uses token-based access instead, this might not be required.
- Username: The username for authenticating with your Prometheus server (if authentication is enabled).
- Password: The password associated with the username.
-
Click Save to enable the integration.
Sample Prompts
Here are a few sample prompts that you can use:
- What's the error rate trend for the payment service over the last 6 hours?
- Show me CPU usage across all production pods.
- Compare response times between canary and stable deployments.
- Which services have the highest latency right now?
- Graph memory usage for the authentication service.