Grafana Loki
Connect Aiden with your Grafana Loki logging system to get intelligent assistance with log analysis, troubleshooting, and observability. Once enabled, Aiden can help you investigate issues by analyzing your logs through natural conversations.
Integrations Capabilities
With Loki integration, Aiden can:
- Search and analyze logs across all services.
- Perform root cause analysis of incidents.
- Track error patterns and anomalies.
- Correlate logs across different services.
- Help debug production issues.
- Analyze log volume trends.
- Investigate specific request flows.
Enable Grafana Loki Integration
Follow these steps to enable the Integration:
-
From the Aiden home page, click Integrations from the navigation panel to the left.
-
Hover and click the Activate button on the Grafana Loki Integration card.
-
Enter the integration configuration parameters:
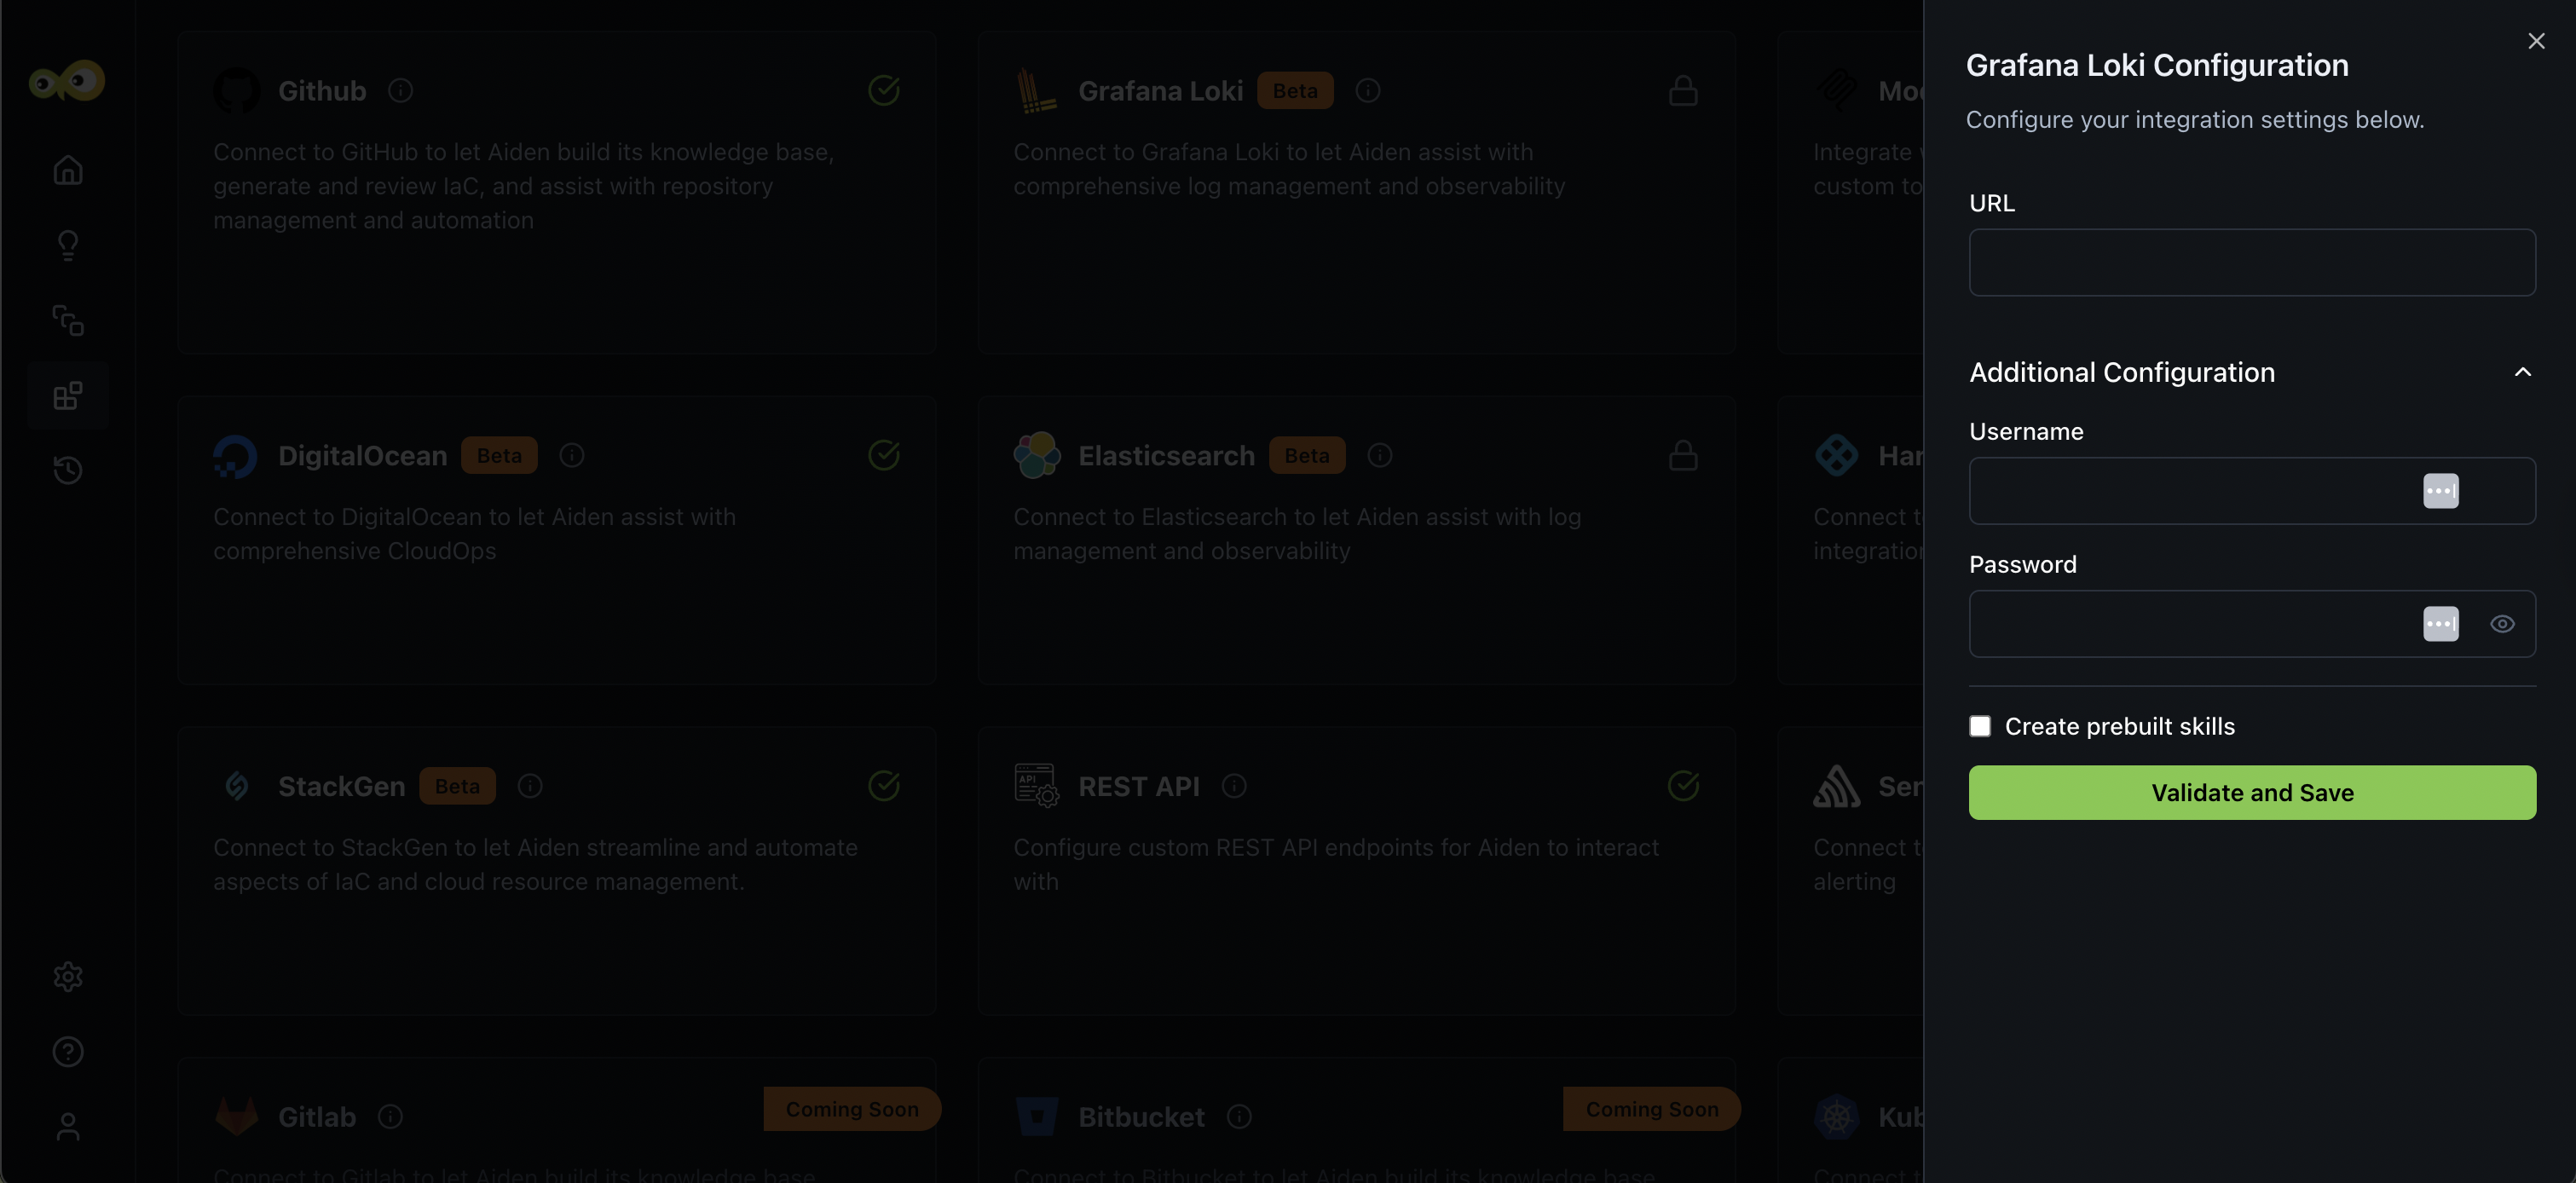
-
URL: This is the endpoint (web address) of your Loki server or Loki Gateway that Aiden will connect to.
- If you're using Grafana Cloud, you can find your Loki endpoint by navigating to Grafana Cloud > Connections > Loki > Details > Endpoint URL.
- Check out HTTP API Overview.
Security Considerations- Use HTTPS for Loki endpoint.
- Implement authentication for Loki access.
- Create dedicated read-only credentials for Aiden's usage.
- Regularly rotate credentials.
- Monitor Loki query logs for audit purposes.
- Ensure your Loki endpoint is accessible from Aiden's network.
-
Additional Configurations:
- Username: The username used to authenticate with your Loki instance.
- This is typically required if your Loki server is protected by Basic Authentication or hosted on Grafana Cloud
- For Grafana Cloud users, the username is often your Grafana Cloud Stack ID (e.g., 123456).
- Password: The password or API token associated with your Loki user account.
- If your Loki instance is self-hosted and secured with basic auth, this is the user password.
- For Grafana Cloud, this field should contain your API token, generated under Grafana Cloud > Security > API Keys > New API Key.
- Treat this as a secret and store it securely (e.g., in a vault or secrets manager).
- Username: The username used to authenticate with your Loki instance.
-
-
Click Save to enable the integration.
Sample Prompts
Here are a few sample prompts that you can use:
- Show me error logs from the payment service in the last hour.
- Find all logs related to user ID abc123 across services.
- What's causing the spike in error logs since 2 PM?
- Compare error patterns between canary and stable deployments.
- Search for timeout errors in the authentication service.
Limitations
The Grafana Loki integration can process up to 1,000 log lines at a time.