Install the StackGen Agent
Install the StackGen Agent
The StackGen agent can be installed in seconds on a variety of environments to begin sending your telemetry (metrics, logs, and traces) to your ObserveNow backend.
This section will document how to install the agent on Kubernetes, Docker Swarm, Standalone Linux Machines, and Standalone Microsoft Windows Machines
Kubernetes
Monitoring a Kubernetes cluster is as simple as running a helm chart command on the cluster.
Getting Started
To collect metrics, logs, and traces from a Kubernetes cluster and its applications, run the following command:
$ helm upgrade --install devopsnow-agent -n devopsnow --create-namespace observe-agent \
    --repo https://registry.devopsnow.io/chartrepo/public \
    -f <path to opsverse-values.yaml file>
Following is an example values.yaml file:
cluster_name: first-cluster
logs:
  host: <logsHost>
  username: devopsnow
  password: <password>
  multiline:
    snippet: |
      - multiline:
          firstline: '^\d{2,4}\-\d{2,4}\-\d{2,4} \d{2,4}\:\d{2,4}\:\d{2,4}\.\d{1,6}'
          max_lines: 200

victoria-metrics-agent:
  remoteWriteUrls:
    - https://<metricsHost>/api/v1/write
  extraArgs:
    remoteWrite.basicAuth.password: <password>
    remoteWrite.basicAuth.username: devopsnow
    remoteWrite.label: cluster=first-cluster

otelcollector:
  enabled: true
  jaeger:
    url: "https://<tracesHost>/api/v2/spans"
    auth: "Basic <`echo -n 'devopsnow:<password>' | base64`>"
Single Machine
Some workloads run on a single machine - for example, a 64-bit Linux VM. You may also install the agent to collect metrics from that node (and any subsequent prometheus exporters you install on it) for end-to-end observability.
To do so, simply run:
# for amd64 machines
$ curl -L https://opsverse-public.s3.amazonaws.com/agent/single-node/installer.sh -o installer.sh && chmod +x ./installer.sh

# for arm64 machines
$ curl -L https://opsverse-public.s3.amazonaws.com/agent/single-node/installer-arm64.sh -o installer.sh && chmod +x ./installer.sh

sudo ./installer.sh -- -m <metricsHost> -l <logsHost> -t <tracesHost>  -p <password>
You can then verify the agent is running:
$ sudo systemctl status opsverse-agent
If some other service is using the port 12345, you might get an error with opsverse-agent logs as Failed to start OpsVerse Agent
To resolve this error, go to /etc/systemd/system/opsverse-agent.servicefile and add this -server.http.address=127.0.0.1:<port>at the last of ExecStartcommand. Please replace the placeholder <port> with port other than 12345.
For example: The/etc/systemd/system/opsverse-agent.service file should look like
...
ExecStart= /usr/local/bin/opsverse-telemetry-agent --config.file=/etc/opsverse/agent-config.yaml -config.expand-env -server.http.address=127.0.0.1:12347
...
Now restart the agent by using the command and this should resolve the issue:
$ sudo systemctl restart opsverse-agent
Scrape Additional Targets
Some services already expose a /metrics endpoint that the agent can scrape and ship.
For the agent to automatically begin collecting those metrics, simply drop a JSON file inside /etc/opsverse/targets/ specifying where to scrape.
For example, you have a local etcd running, your file /etc/opsverse/targets/etcd.json may look like:
[
  {
    "labels": {
      "job": "integrations/etcd"
    },
    "targets": [
      "localhost:2379"
    ]
  }
]
For services that don't expose a /metrics endpoint, we run Prometheus Exporters for those services and scrape those targets instead.
Docker Compose
StackGen agents can be installed using docker compose.
Structure
- Download the StackGen-agent.zip file by using the command below and unzip it.
$ curl -LO https://github.com/OpsVerseIO/installers/raw/main/opsverse-agent.zip

$ unzip opsverse-agent.zip
NOTE: You should have three files in the opsverse-agent folder; .env, docker-compose.yaml and agent/config/agent.yaml
Configuration
.envis the only file you need to edit. The editable variables in the.envfile can be found in your StackGen Admin Console.- After editing the variables in the
.envfile, run the below command:
$ docker-compose up -d
Microsoft Windows
Installing the StackGen ObserveNow Agent on machines running Microsoft Windows (64-bit, Windows Server 2016 or newer; requires Windows PowerShell 5.1+).
The agent runs as a single Windows service, StackGen ObserveNow Agent. The base install collects Windows system metrics and Application event logs; additional components (SQL Server, nginx, JVM, traces, and more) can be added on demand.
Getting Started
-
Download the observenow-agent-windows.zip and unzip it.
-
Open Windows PowerShell as an
administrator, change into the unzippedobservenow-agent-windowsfolder, and run:
.\installation.ps1 -Hostname "<unique-hostname>" `
    -MetricsUrl "<metricsHost>" `
    -LogsUrl "<logsHost>" `
    -Password "<password>"
-Hostnameis a unique name that identifies this machine in your dashboards.- The values for the ObserveNow Metrics URL, Logs URL, and Password can be found in your StackGen Admin Console under
ObserveNow>Integrations>URLs and Integration Credentials. URLs may be given with or without the scheme/path - they are normalized automatically. - If any parameter is omitted, PowerShell will prompt you for it.
The installer sets up and configures the agent to capture metrics and event logs from the Windows machine. Any legacy StackGen Windows agent installation found on the machine is removed automatically as part of the install. Re-running the installer upgrades the agent in place.
Verify the Installation
- The
StackGen ObserveNow Agentservice should be up and running inServices.msc, or check the agent health endpoint:
Invoke-WebRequest http://localhost:12345/-/healthy -UseBasicParsing
- Under the
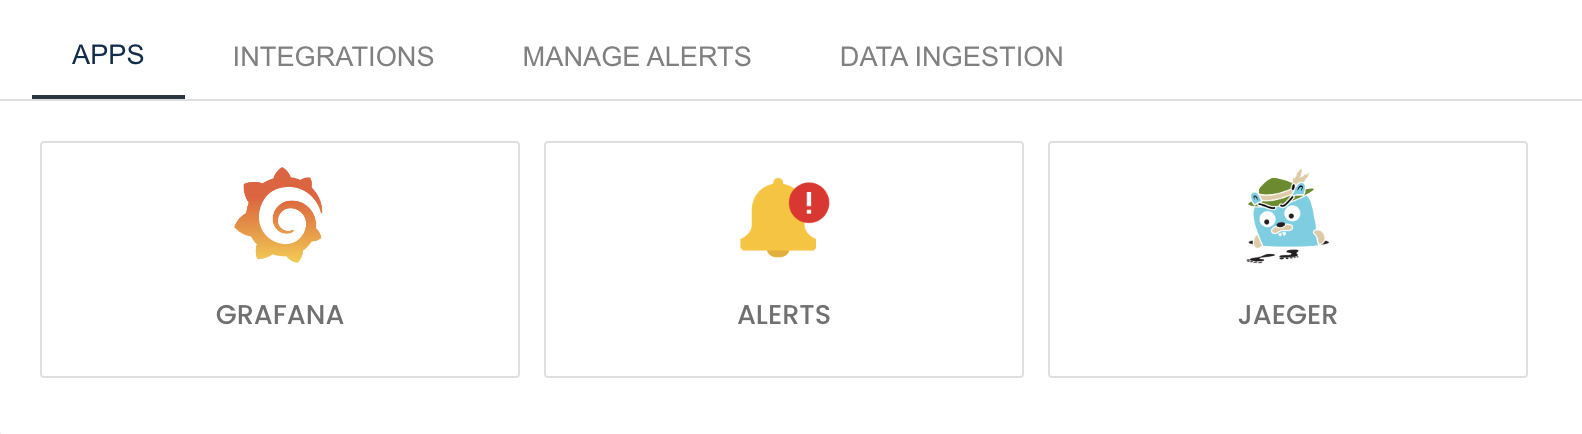
Appssection of your ObserveNow instance, click on the Grafana icon and go to theExploresection. Your Windows host should show machine-specific metrics and logs flowing in:
up{job="integrations/windows-exporter", instance="<hostname>"}
{job="windows-events", host="<hostname>"}
Monitor Additional Components
To monitor services running on the machine (SQL Server, MySQL, PostgreSQL, Redis, Kafka, nginx, JVM/JMX, Java log files, OTLP traces, and more), use install-exporter.ps1 from the same folder. For example:
.\install-exporter.ps1 -Exporter mssql -ConnectionString "sqlserver://monitor_user:pass@localhost:1433"
.\install-exporter.ps1 -Exporter nginx
.\install-exporter.ps1 -Exporter otel -TracesUrl "https://<tracesHost>"
.\install-exporter.ps1 -Exporter mssql -Remove
Each component is validated and hot-reloaded into the running agent - no service restart required. See the README.md inside the zip for the full list of supported components and their parameters.