Activity Logs
The Activity Logs page provides a centralized view of all system events, allowing platform engineers and administrators to track actions across the StackGen platform. This feature captures and indexes every agent invocation, chat interaction or user interaction. In other words, the 5 W's – Who, What, When, Where, Why, making them available for search, filtering, and drill-down inspection.
With Activity Logs, you can:
- Audit system usage and agent activity.
- Filter by user, appStack, action, or time range.
- Inspect detailed event payloads for troubleshooting and compliance.
The most common use cases of these logs are:
- Audit: See which user added or removed resources from a topology.
- Compliance: Track ownership and changes across AppStacks.
- Debugging: Inspect resource-level JSON logs for troubleshooting.
Let's learn about Activity Logs in detail.
Accessing Activity Logs
Click to view
Follow these steps to view Activity Logs:
-
From the StackGen Home page, click Activity Logs.
-
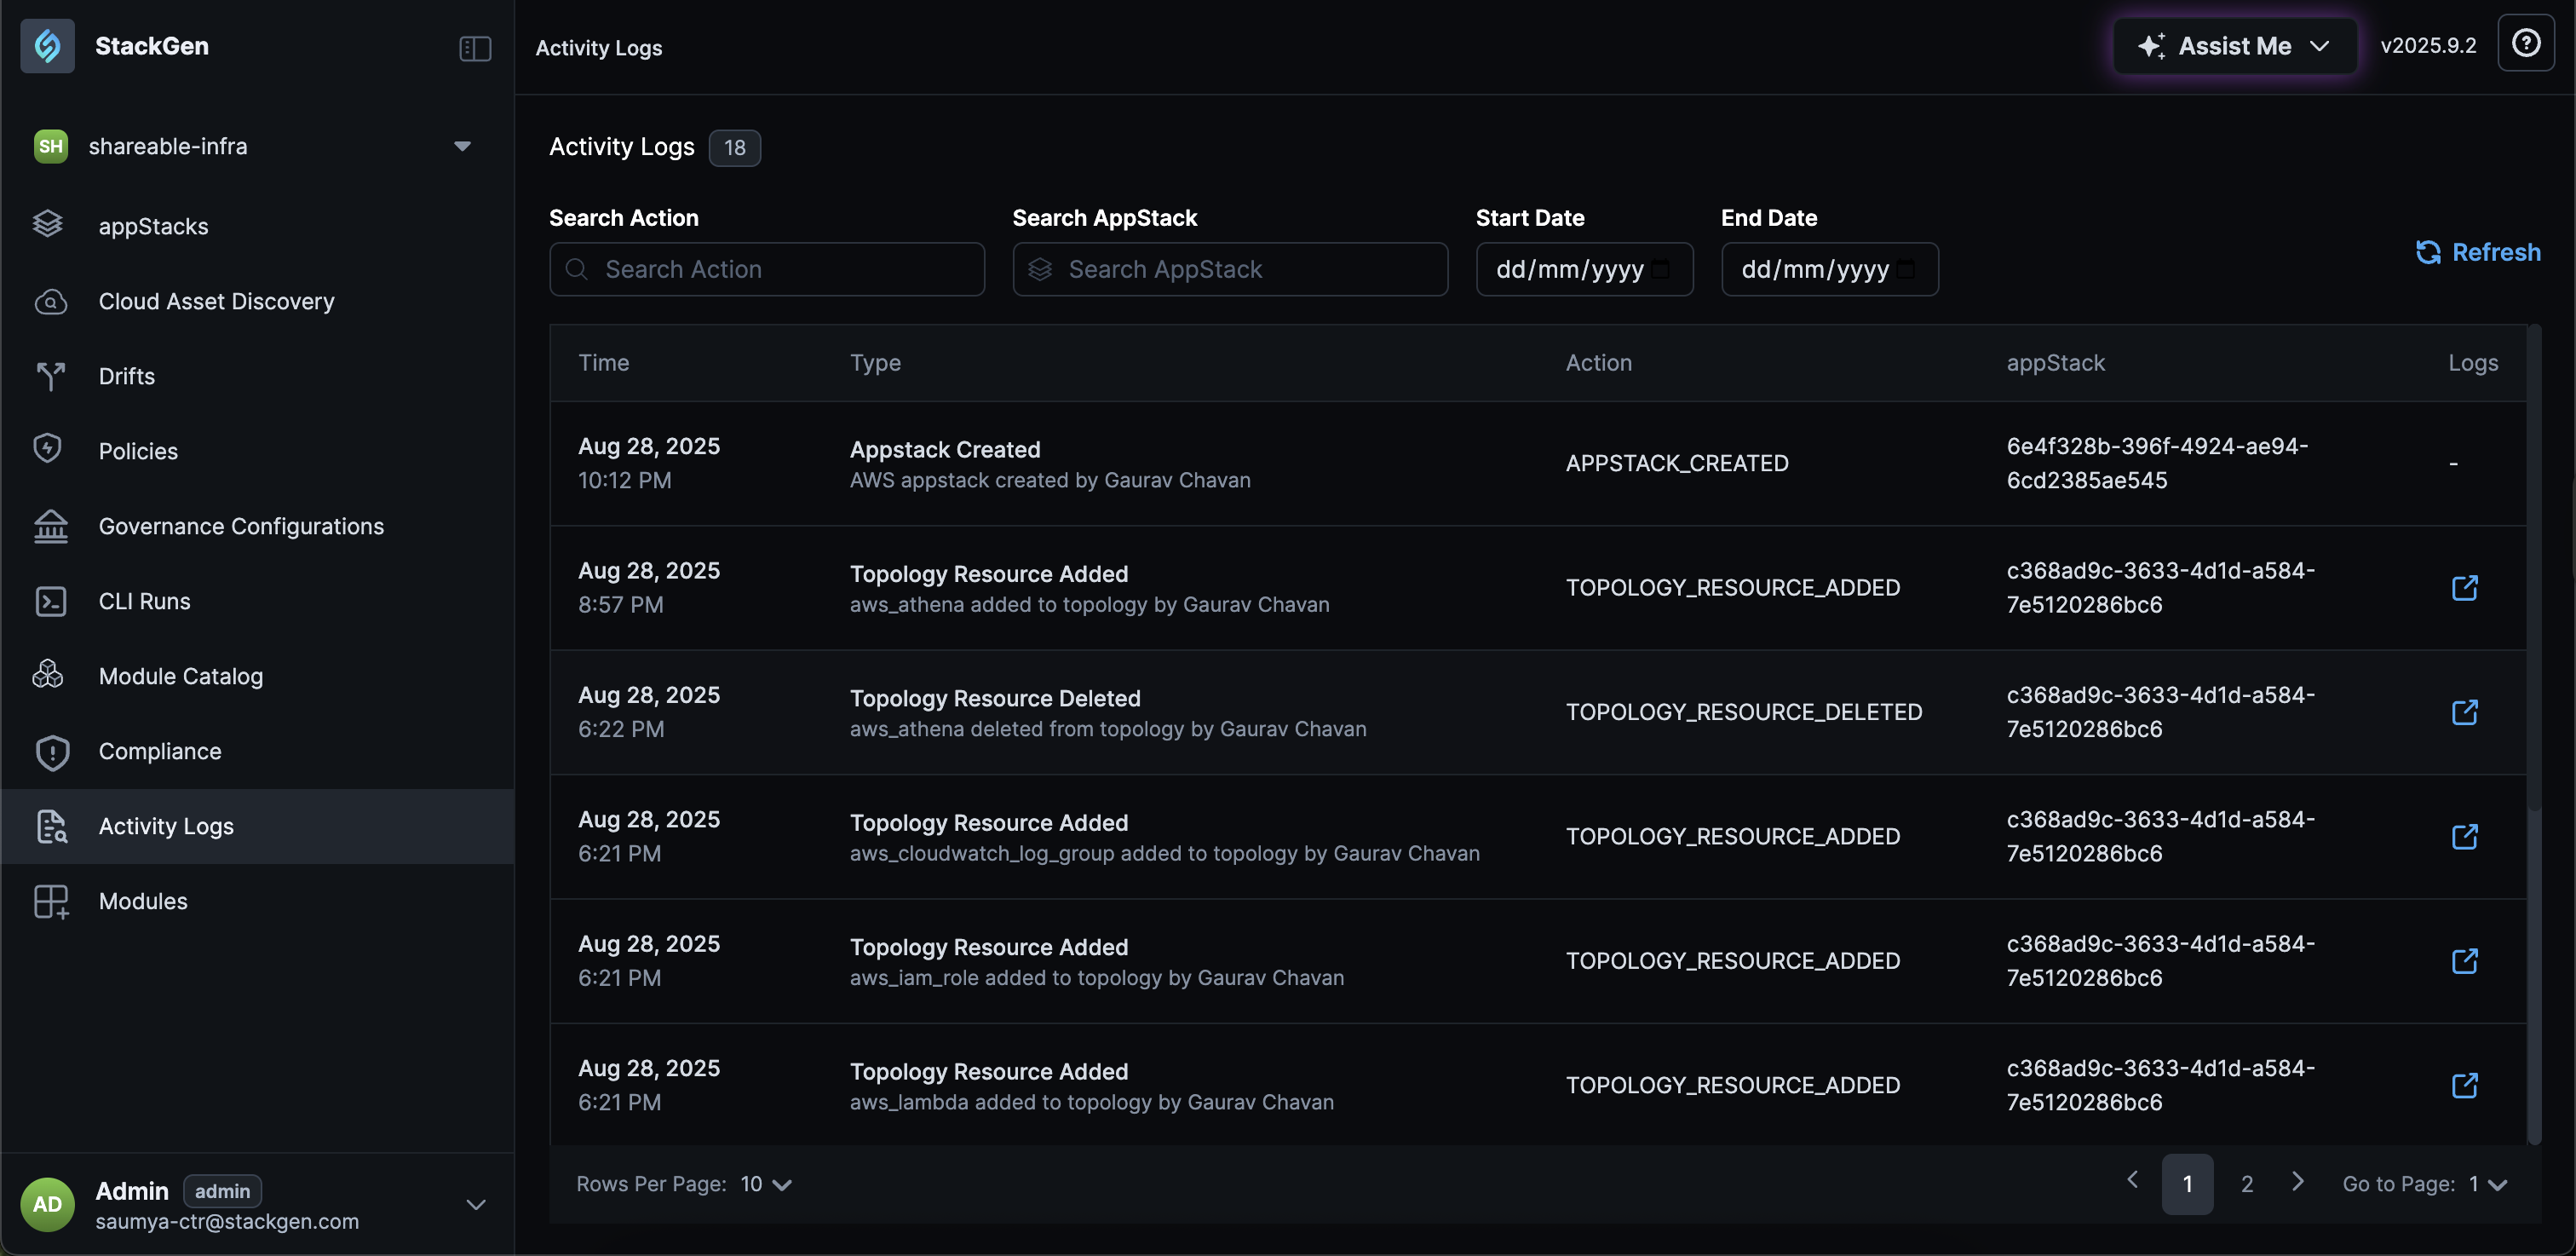
You will see a table which lists log entries with:
- Time: When the action occurred.
- Type: Event category (e.g., AppStack Created, Topology Resource Added).
- Action: System action identifier (e.g.,
APPSTACK_CREATED,TOPOLOGY_RESOURCE_ADDED). - appStack: The resource ID associated with the event.
- Logs: Drill-down link to view detailed event data.
Filtering Activity Logs
Click to view
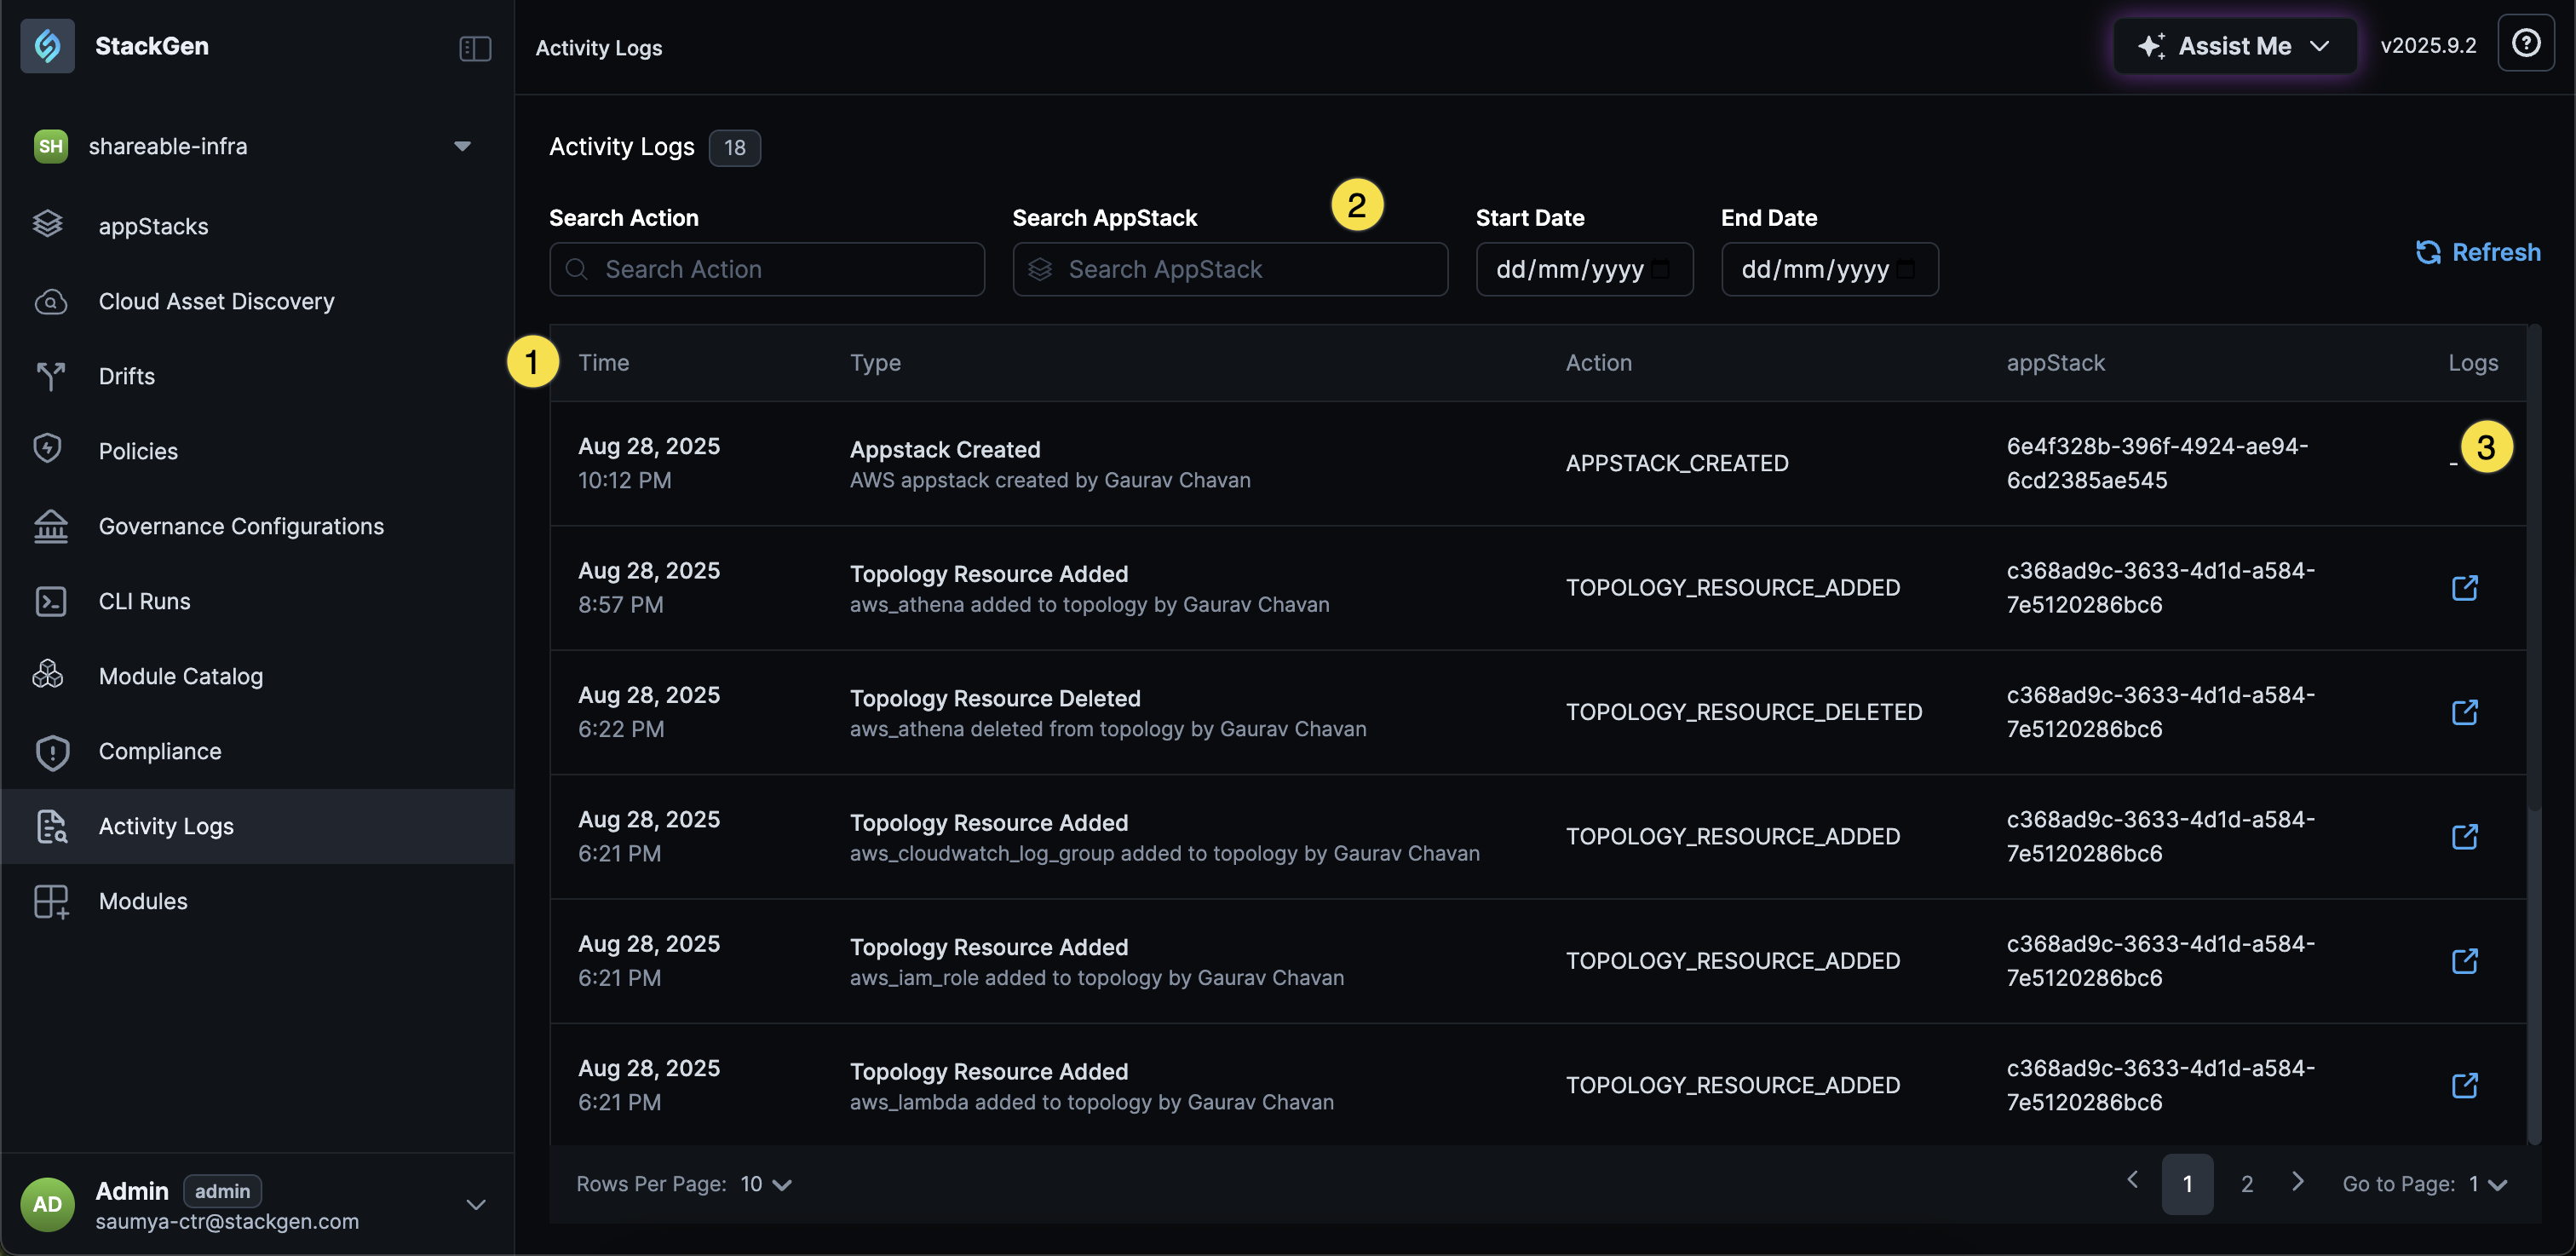
Use the filters (2) above the table to refine results:
- Search Action: Filter by action type (e.g.,
TOPOLOGY_RESOURCE_ADDED). - Search appStack: Narrow results to a specific appStack ID.
- Start Date / End Date: Select a date range for events.
- Refresh: Click Refresh to view latest logs.
Viewing Detailed Logs
Click to view
Click the link for a an activity log under the Logs column to open a JSON view of the event.
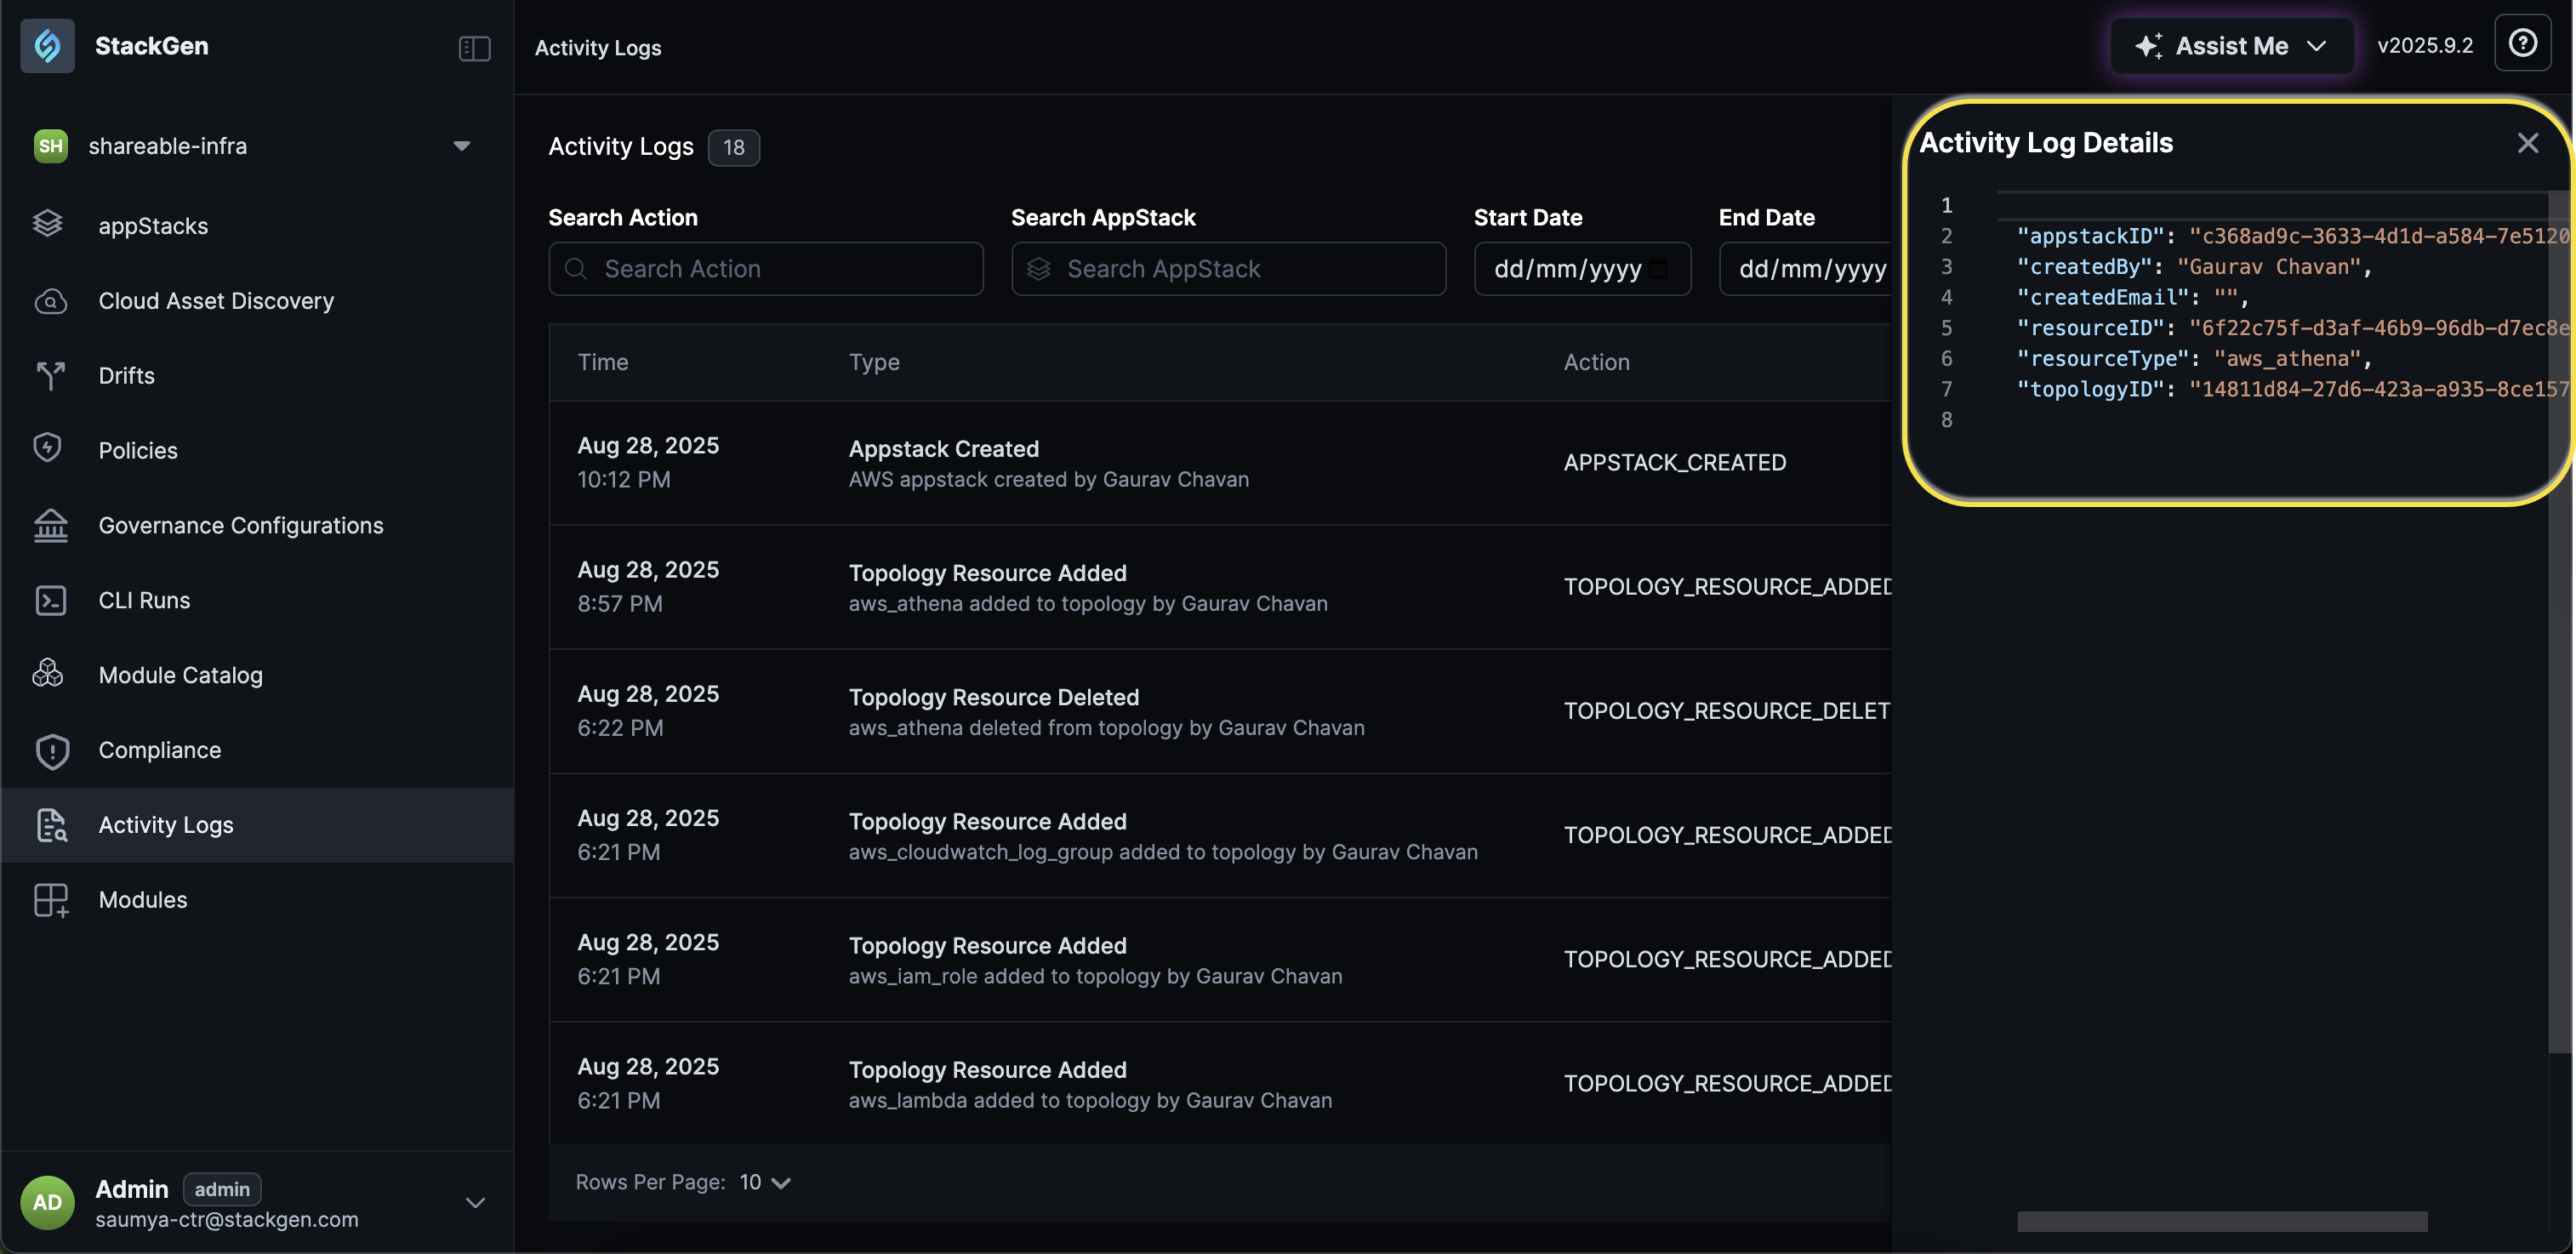
The log details include metadata such as:
appstackIDcreatedByresourceTyperesourceIDtopologyID
You can use this view to debug resource changes or validate actions.