CLI Runs
Overview
The CLI Runs tab in StackGen bridges the gap between StackGen’s Web UI and CLI workflows, providing comprehensive visibility into all appStack lifecycle actions, regardless of the interface used.
This tab ensures that key actions, such as provisioning and destruction initiated through the CLI, are seamlessly captured and reflected in the Web UI.
Many of your projects, including DevOps and Engineering, prefer using the StackGen CLI for its speed and scriptability, but this can create a visibility gap where actions triggered via CLI are not reflected in the UI. This gap impacts auditability, operational transparency, and cross-team collaboration. The CLI Runs tab resolves this issue by bringing together CLI and Web UI activities into a single, unified view.
Let’s explore the CLI Runs dashboard in more detail.
CLI Runs Dashboard
To view the CLI Runs dashboard, follow these steps:
-
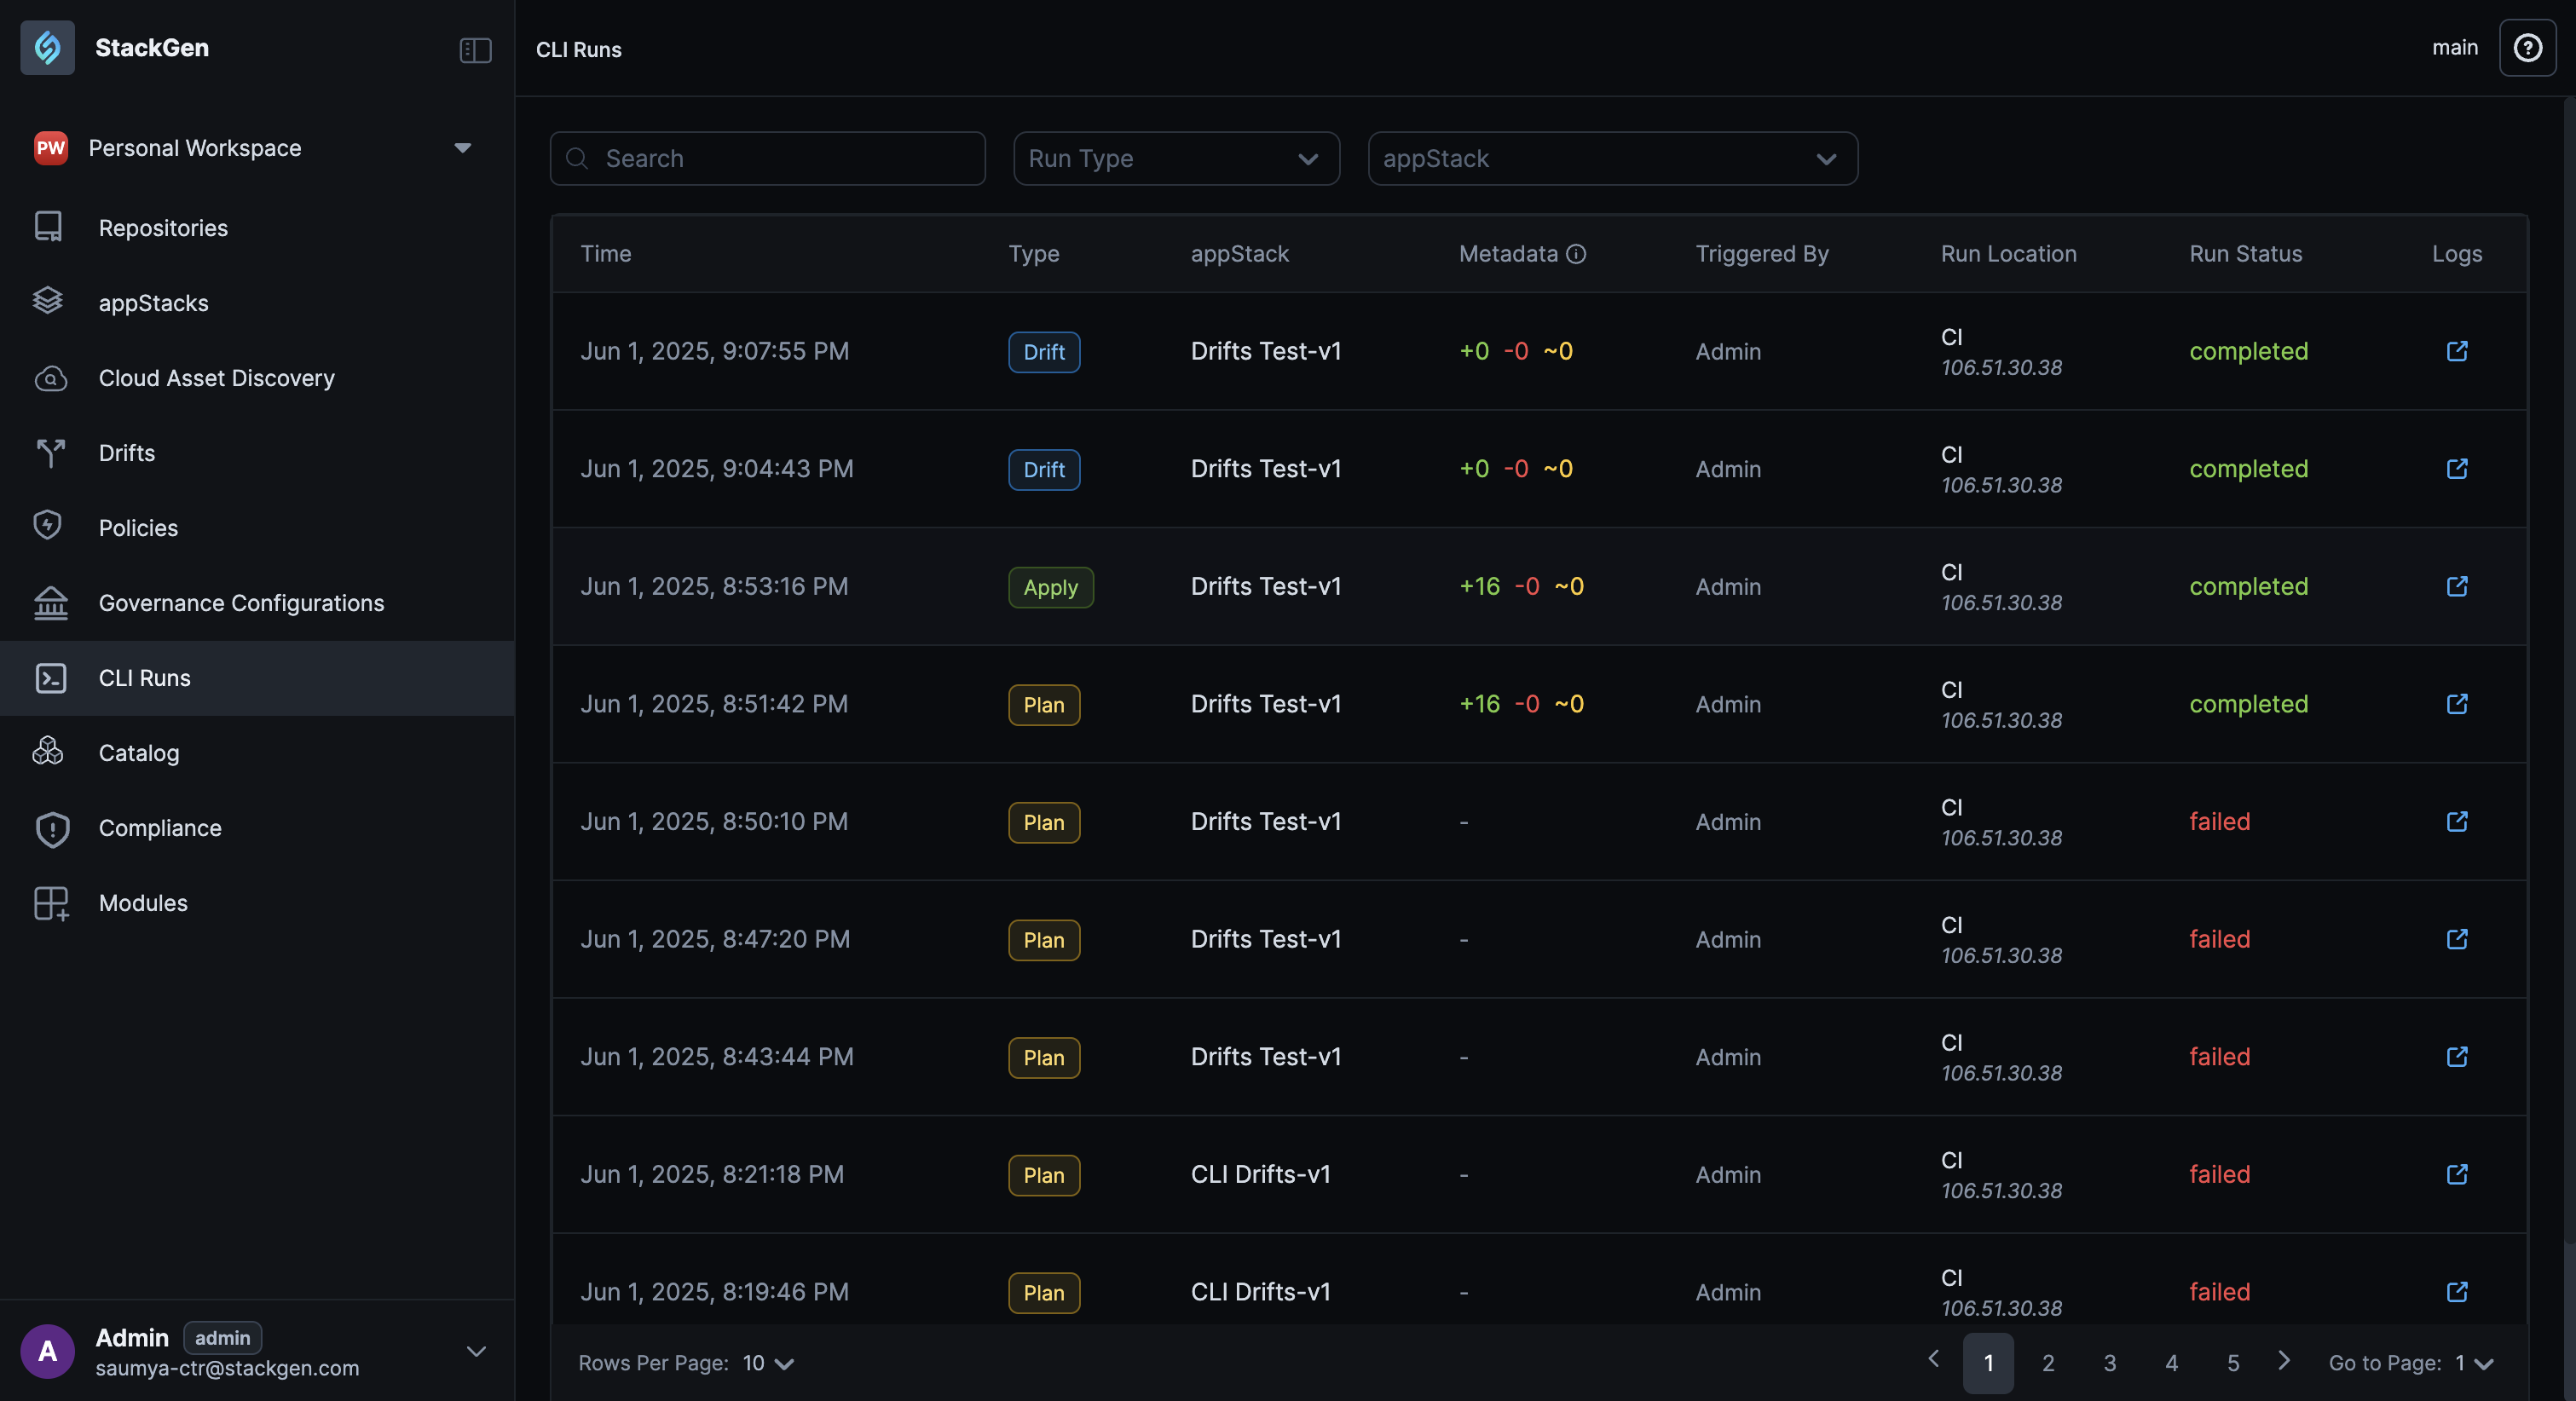
From the StackGen Home page, click CLI Runs from the navigation panel to the left.
-
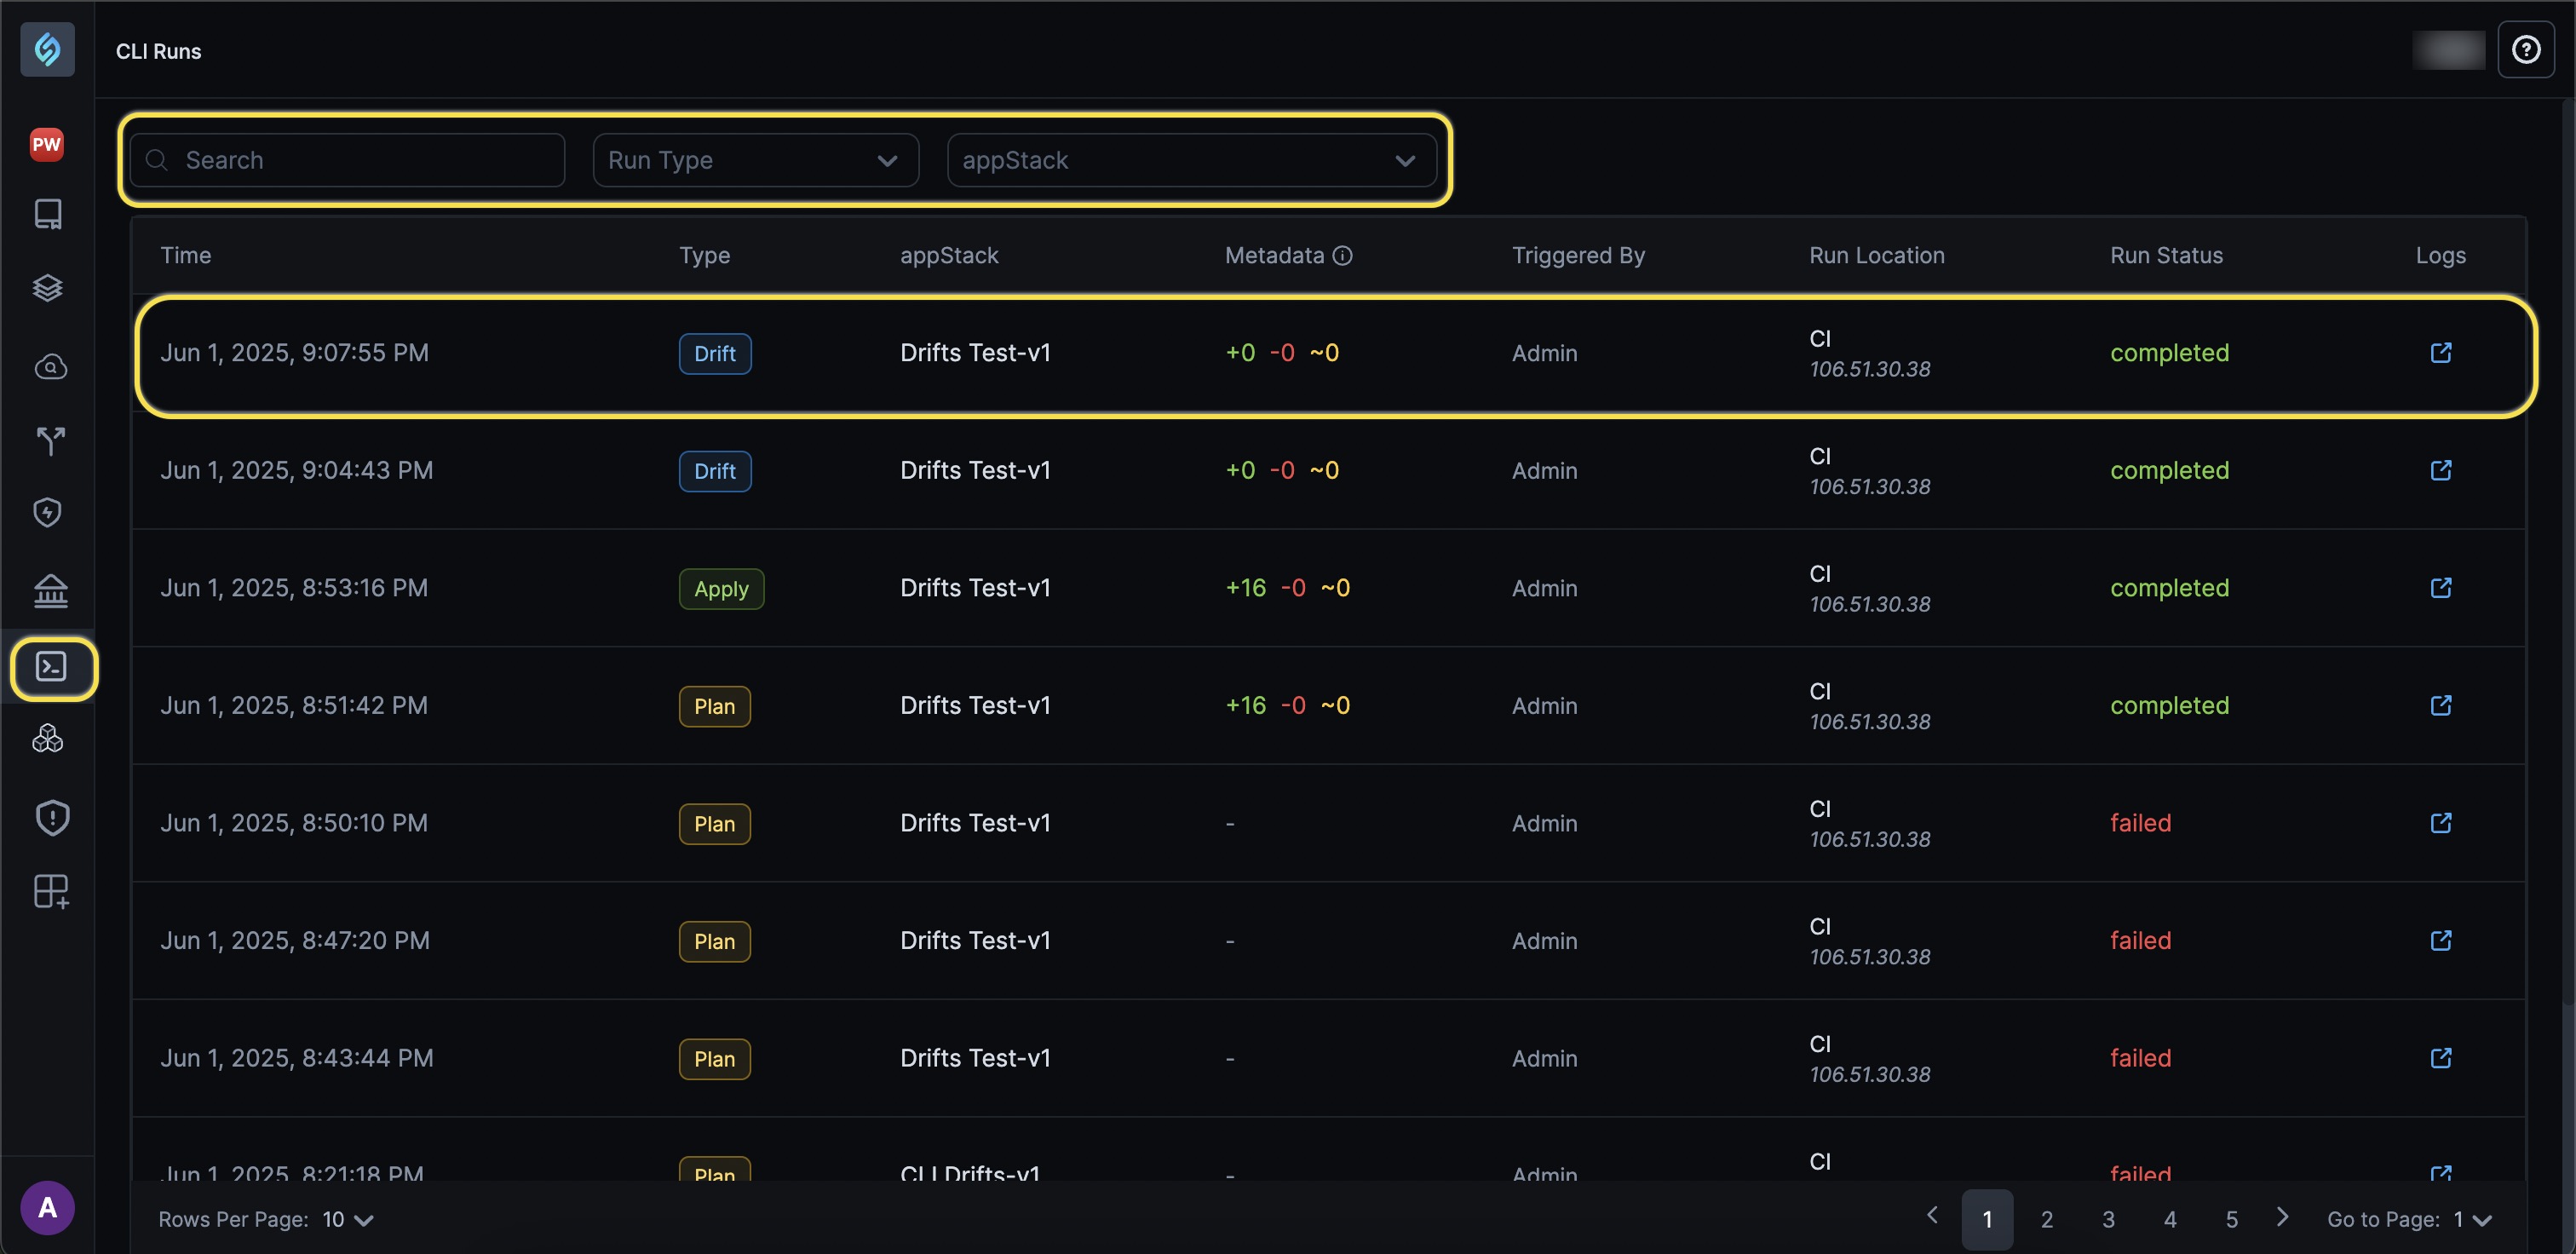
You can filter your CLI Runs by the Run Type or the appStack.
 note
noteCurrently, StackGen supports the following CLI runs in the CLI Runs Dashboard:
- Plan
- Apply
- Destroy
- Drift
-
You can view your run log to view your CI runs if you have used the
--ci-job-url=<your ci url>flag while running your CLI job.stackgen provision --appstack-id="your appstack id" --var="region=<region>" --ci-job-url=<your ci job url> --apply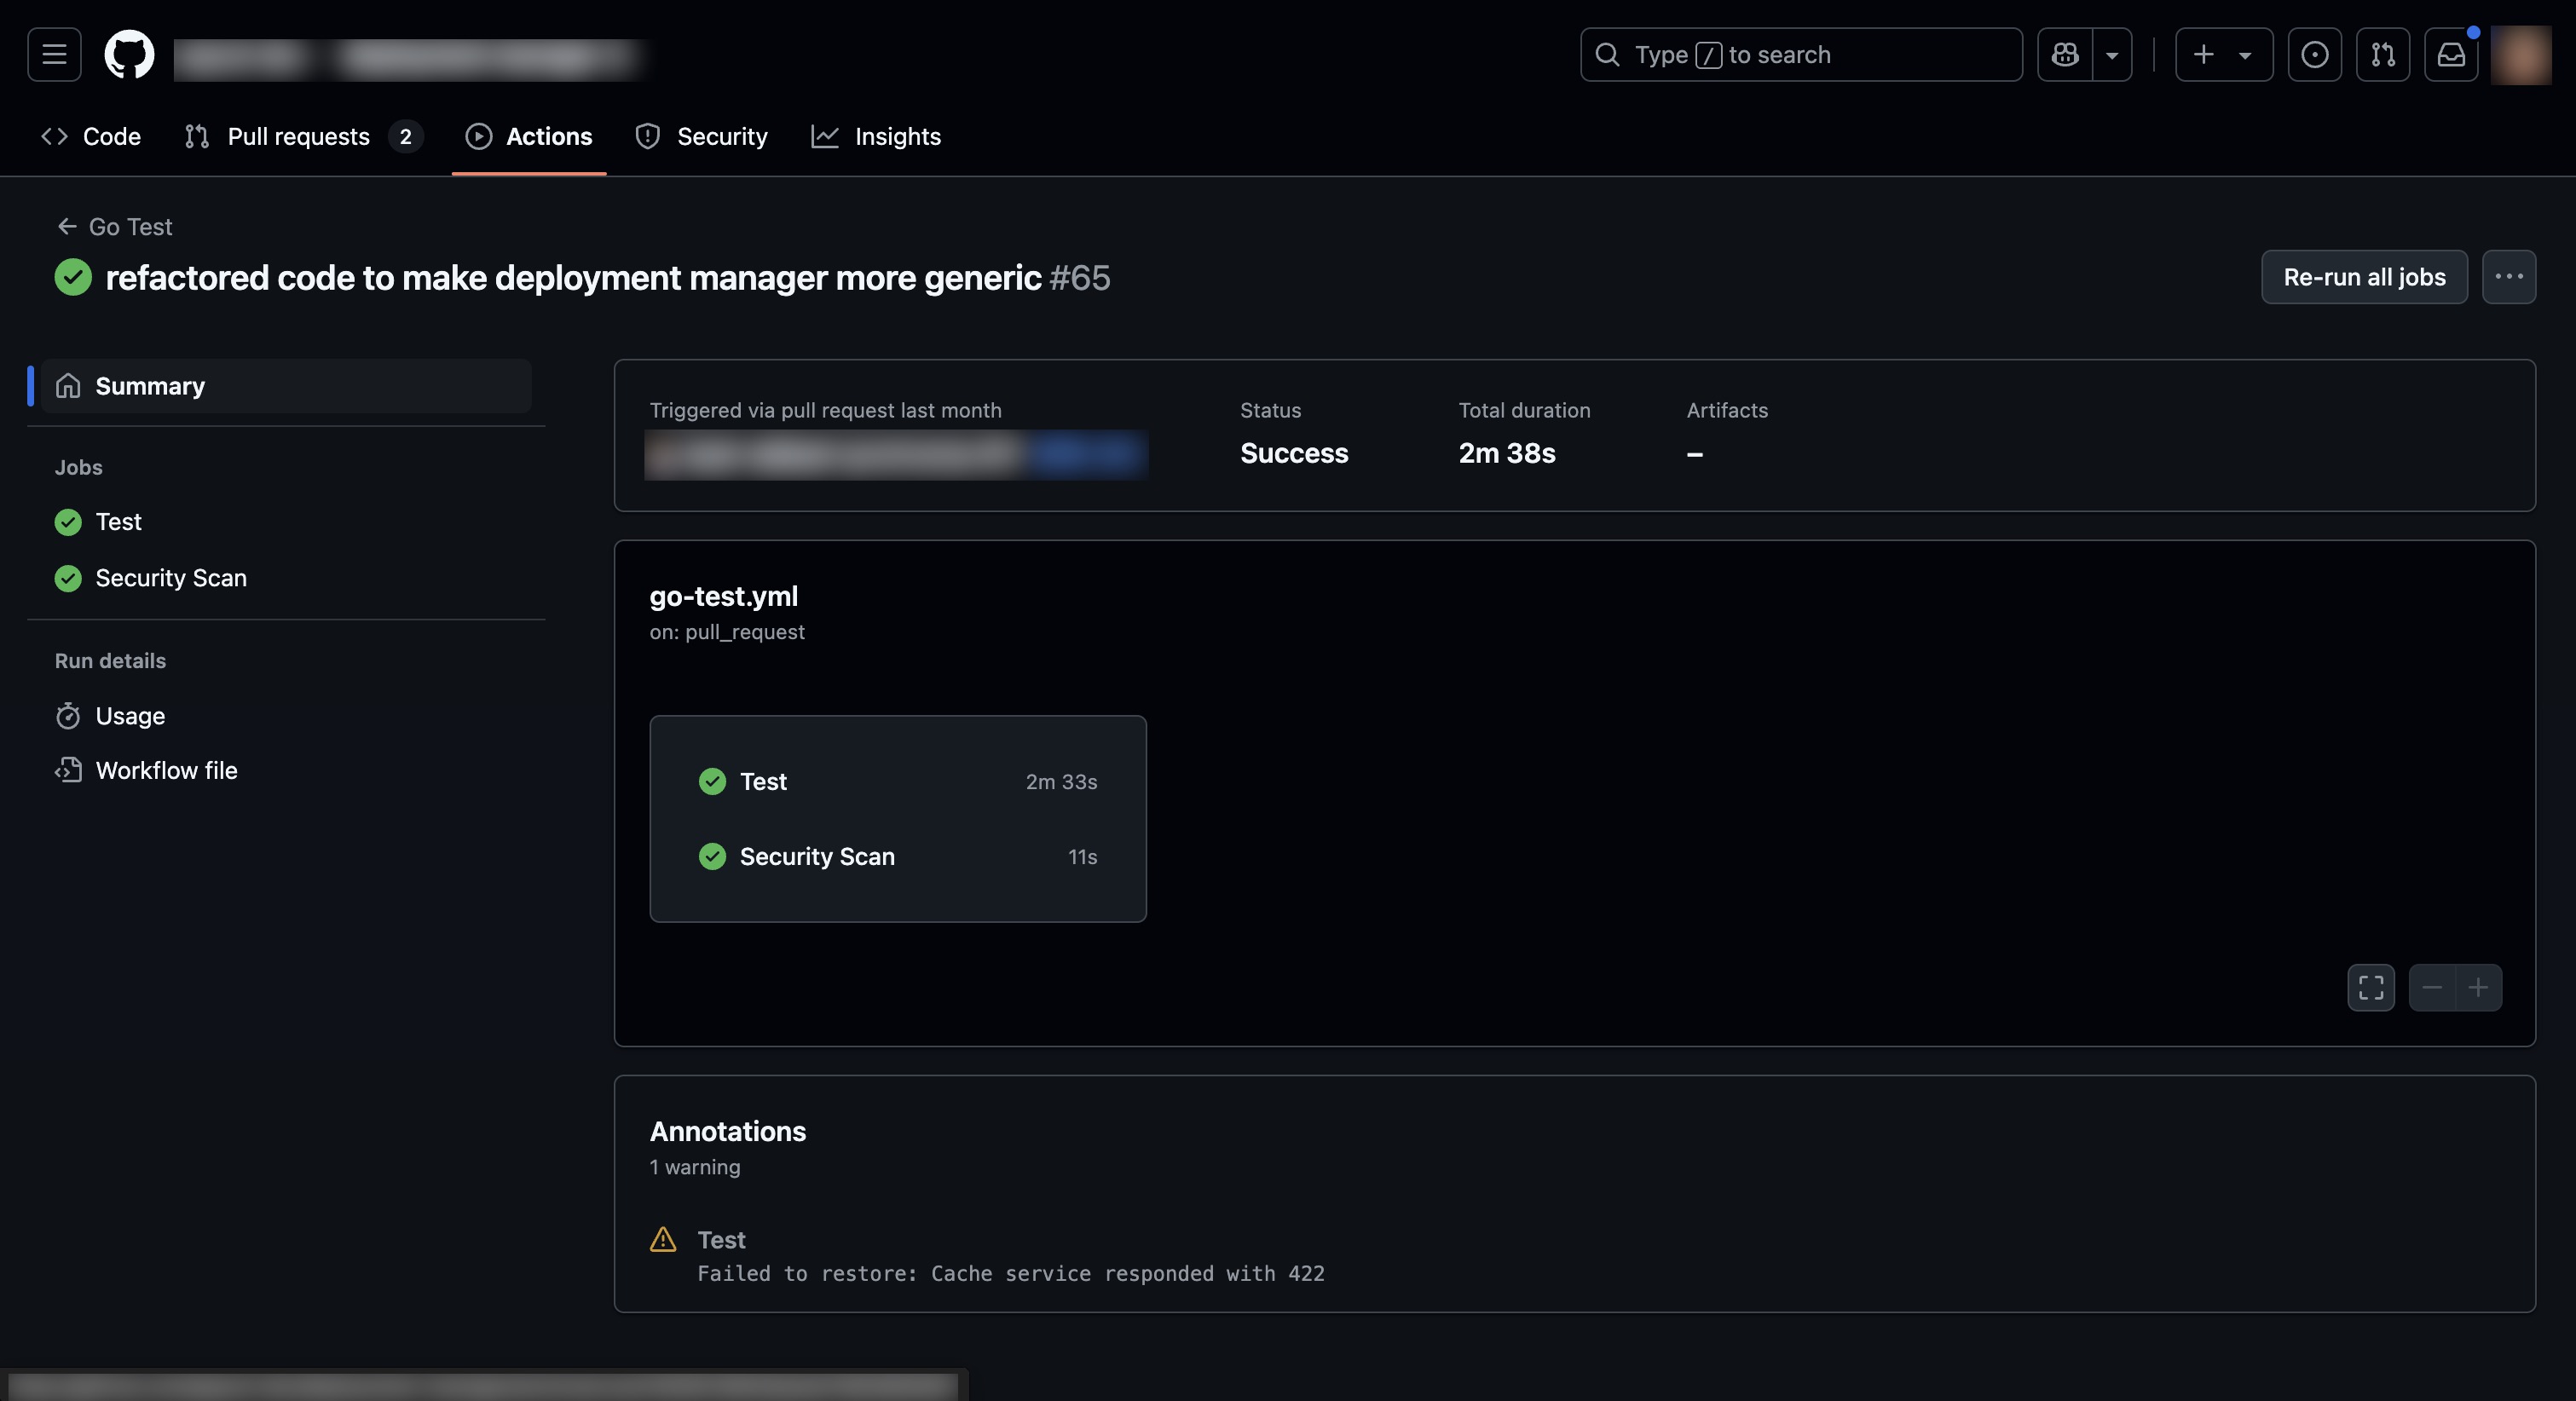
-
To view the changes of your runs in detail, click on any of the rows in the dashboard. You will be able to view the following details:
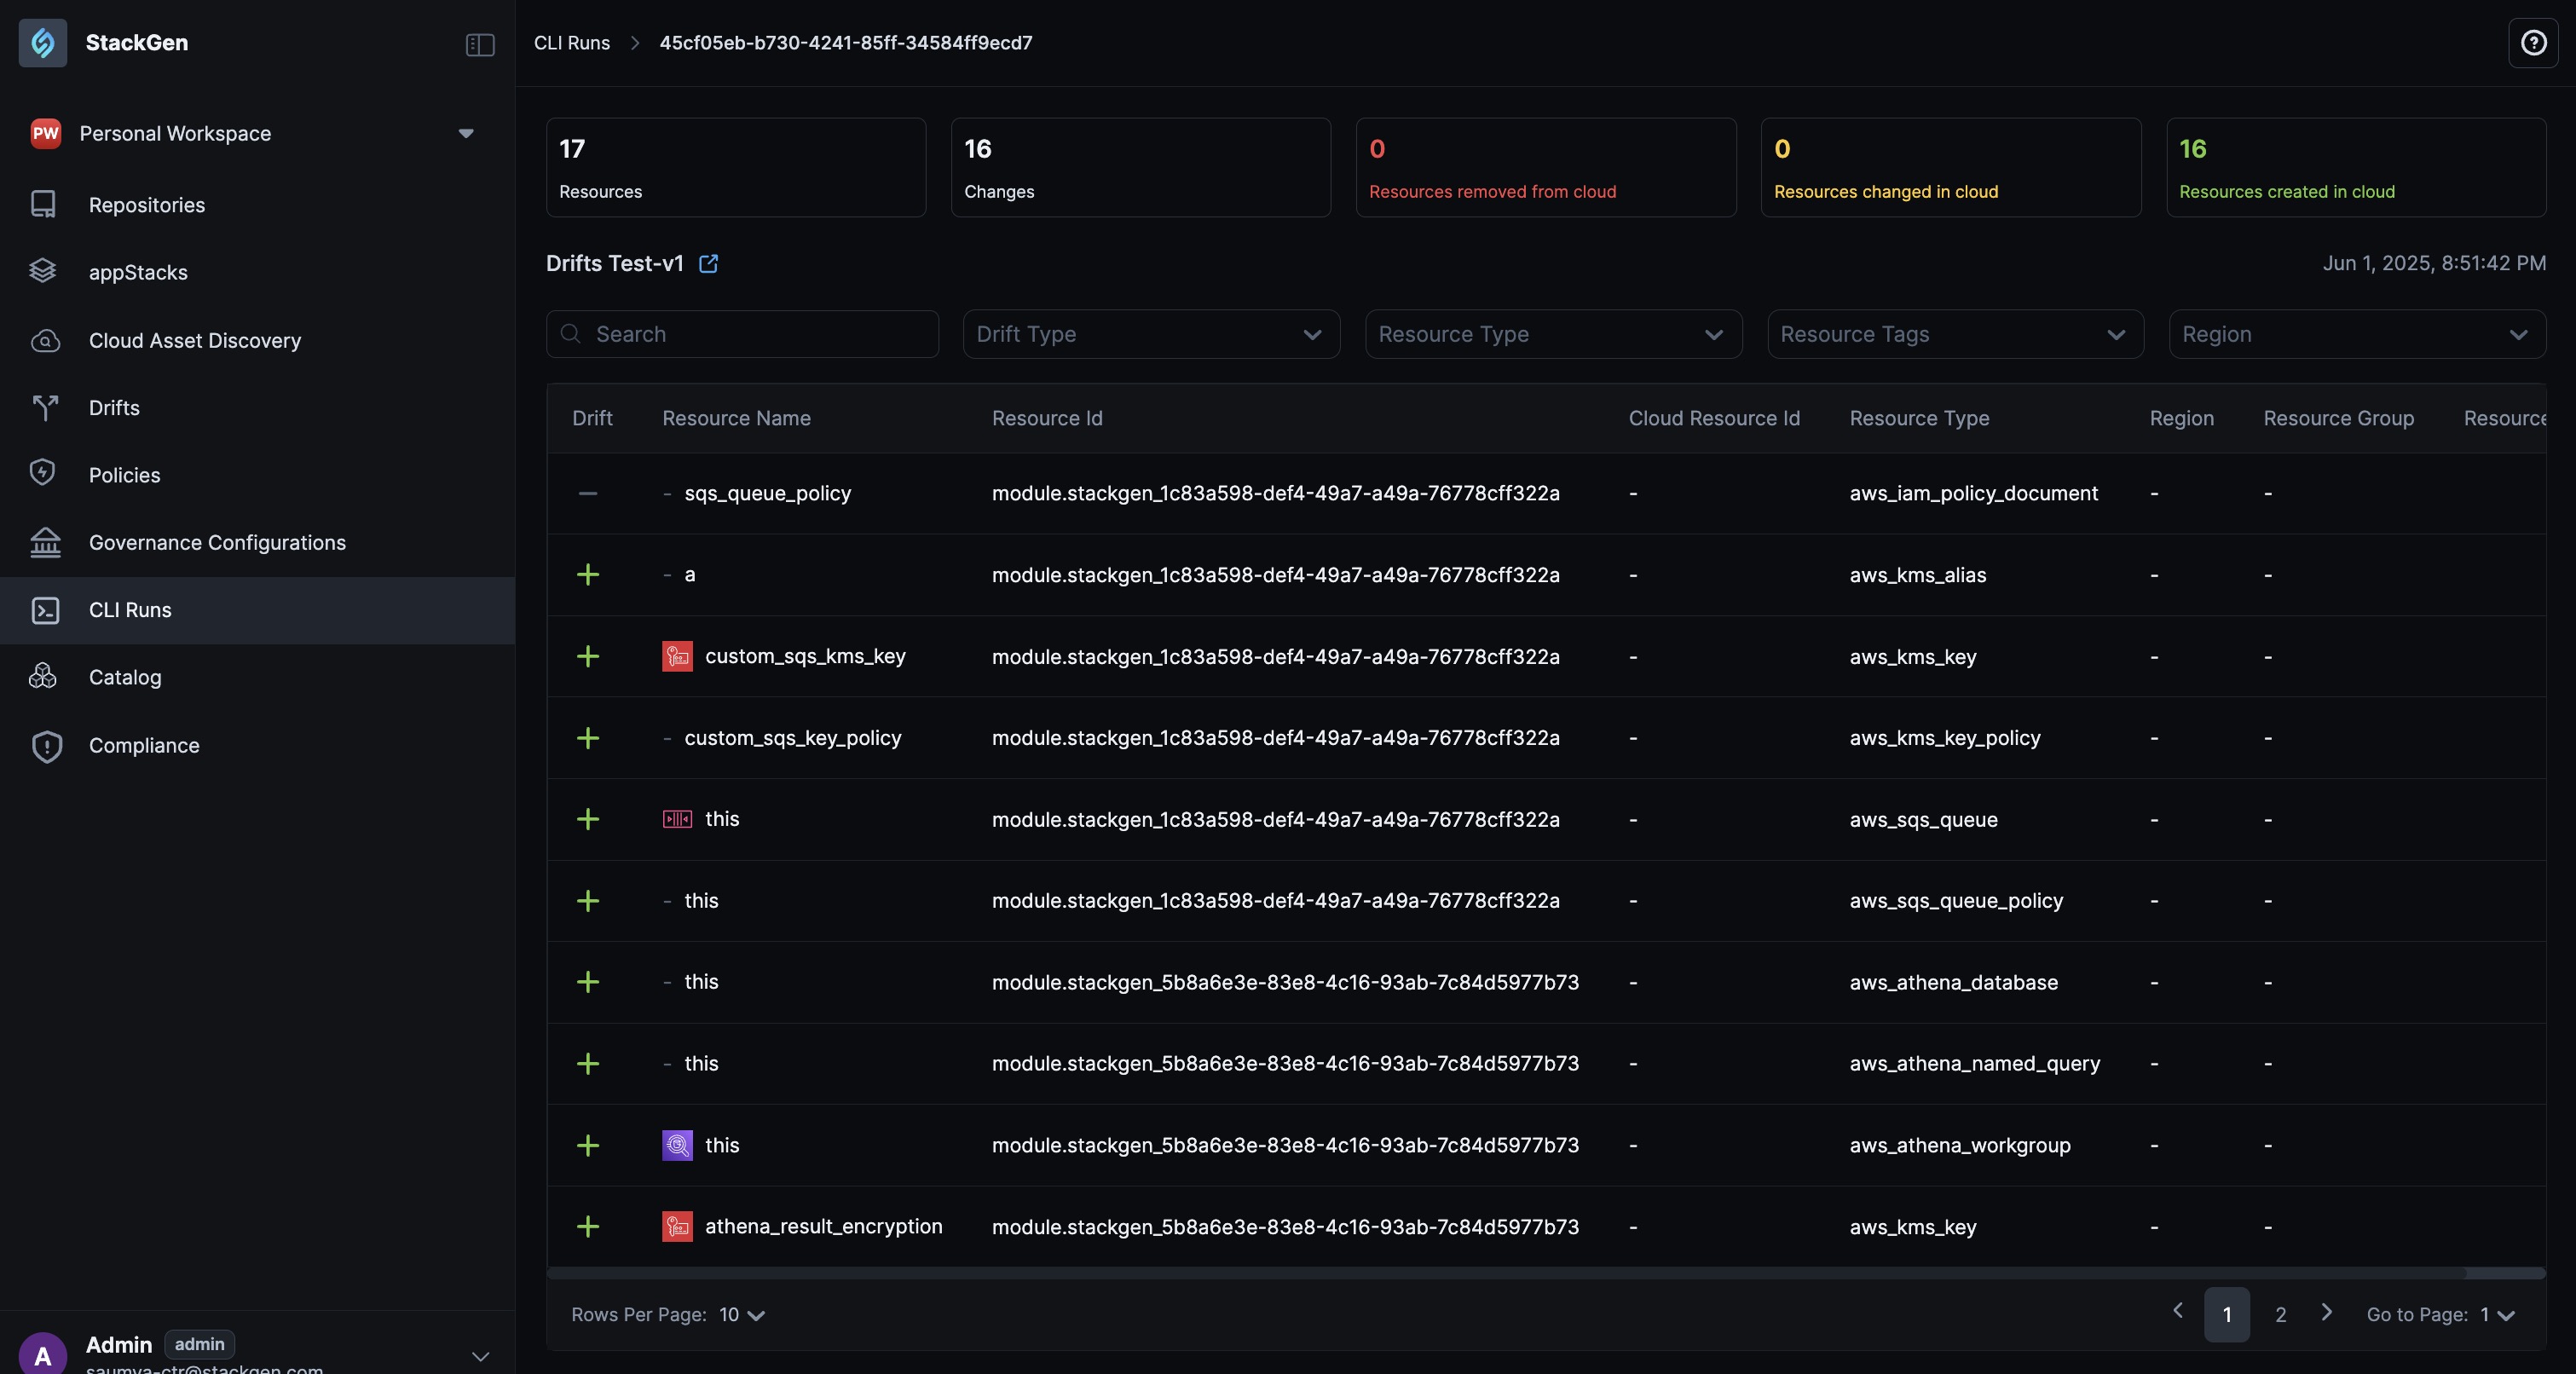
-
Drift Snapshot: A brief snapshot of your CLI Run. Let's break down what each section means:
- Number of resources: This count reflects the total number of resources that were part of the CLI run, whether they were changed, removed, or newly created. It gives you a quick sense of the overall scale of the operation. Example: If your appStack provisions a VPC, an EC2 instance, and a security group, the total number of resources would be 3.
- Changes: A summary of all additions, updates, and deletions.
- Resources removed from cloud: Resources that were deleted from your cloud environment.
- Resources changed in cloud: Resources that were updated (e.g., a change in configuration, tags, or size) during the CLI run.
- Resources created in cloud: New resources added during the run.
-
Search and Filter: You can filter your resources using the filter to the top by Drift Type, Resource Type, Resource Tags, Region or you can search for your resource using the search bar.
-
-
You will notice that the resources appear with an icon next to it. Let’s understand what each of these symbols mean:
Symbol Description — There is no change in the configuration. — The resource has been removed from the cloud but still exists in the configuration. ~ The resource exists in cloud, but its configuration has changed. + A new resource has been added to the cloud that wasn’t previously defined. -
Clicking on any of the resources opens up the diff. You can view the changes that happened before and after a CLI run.
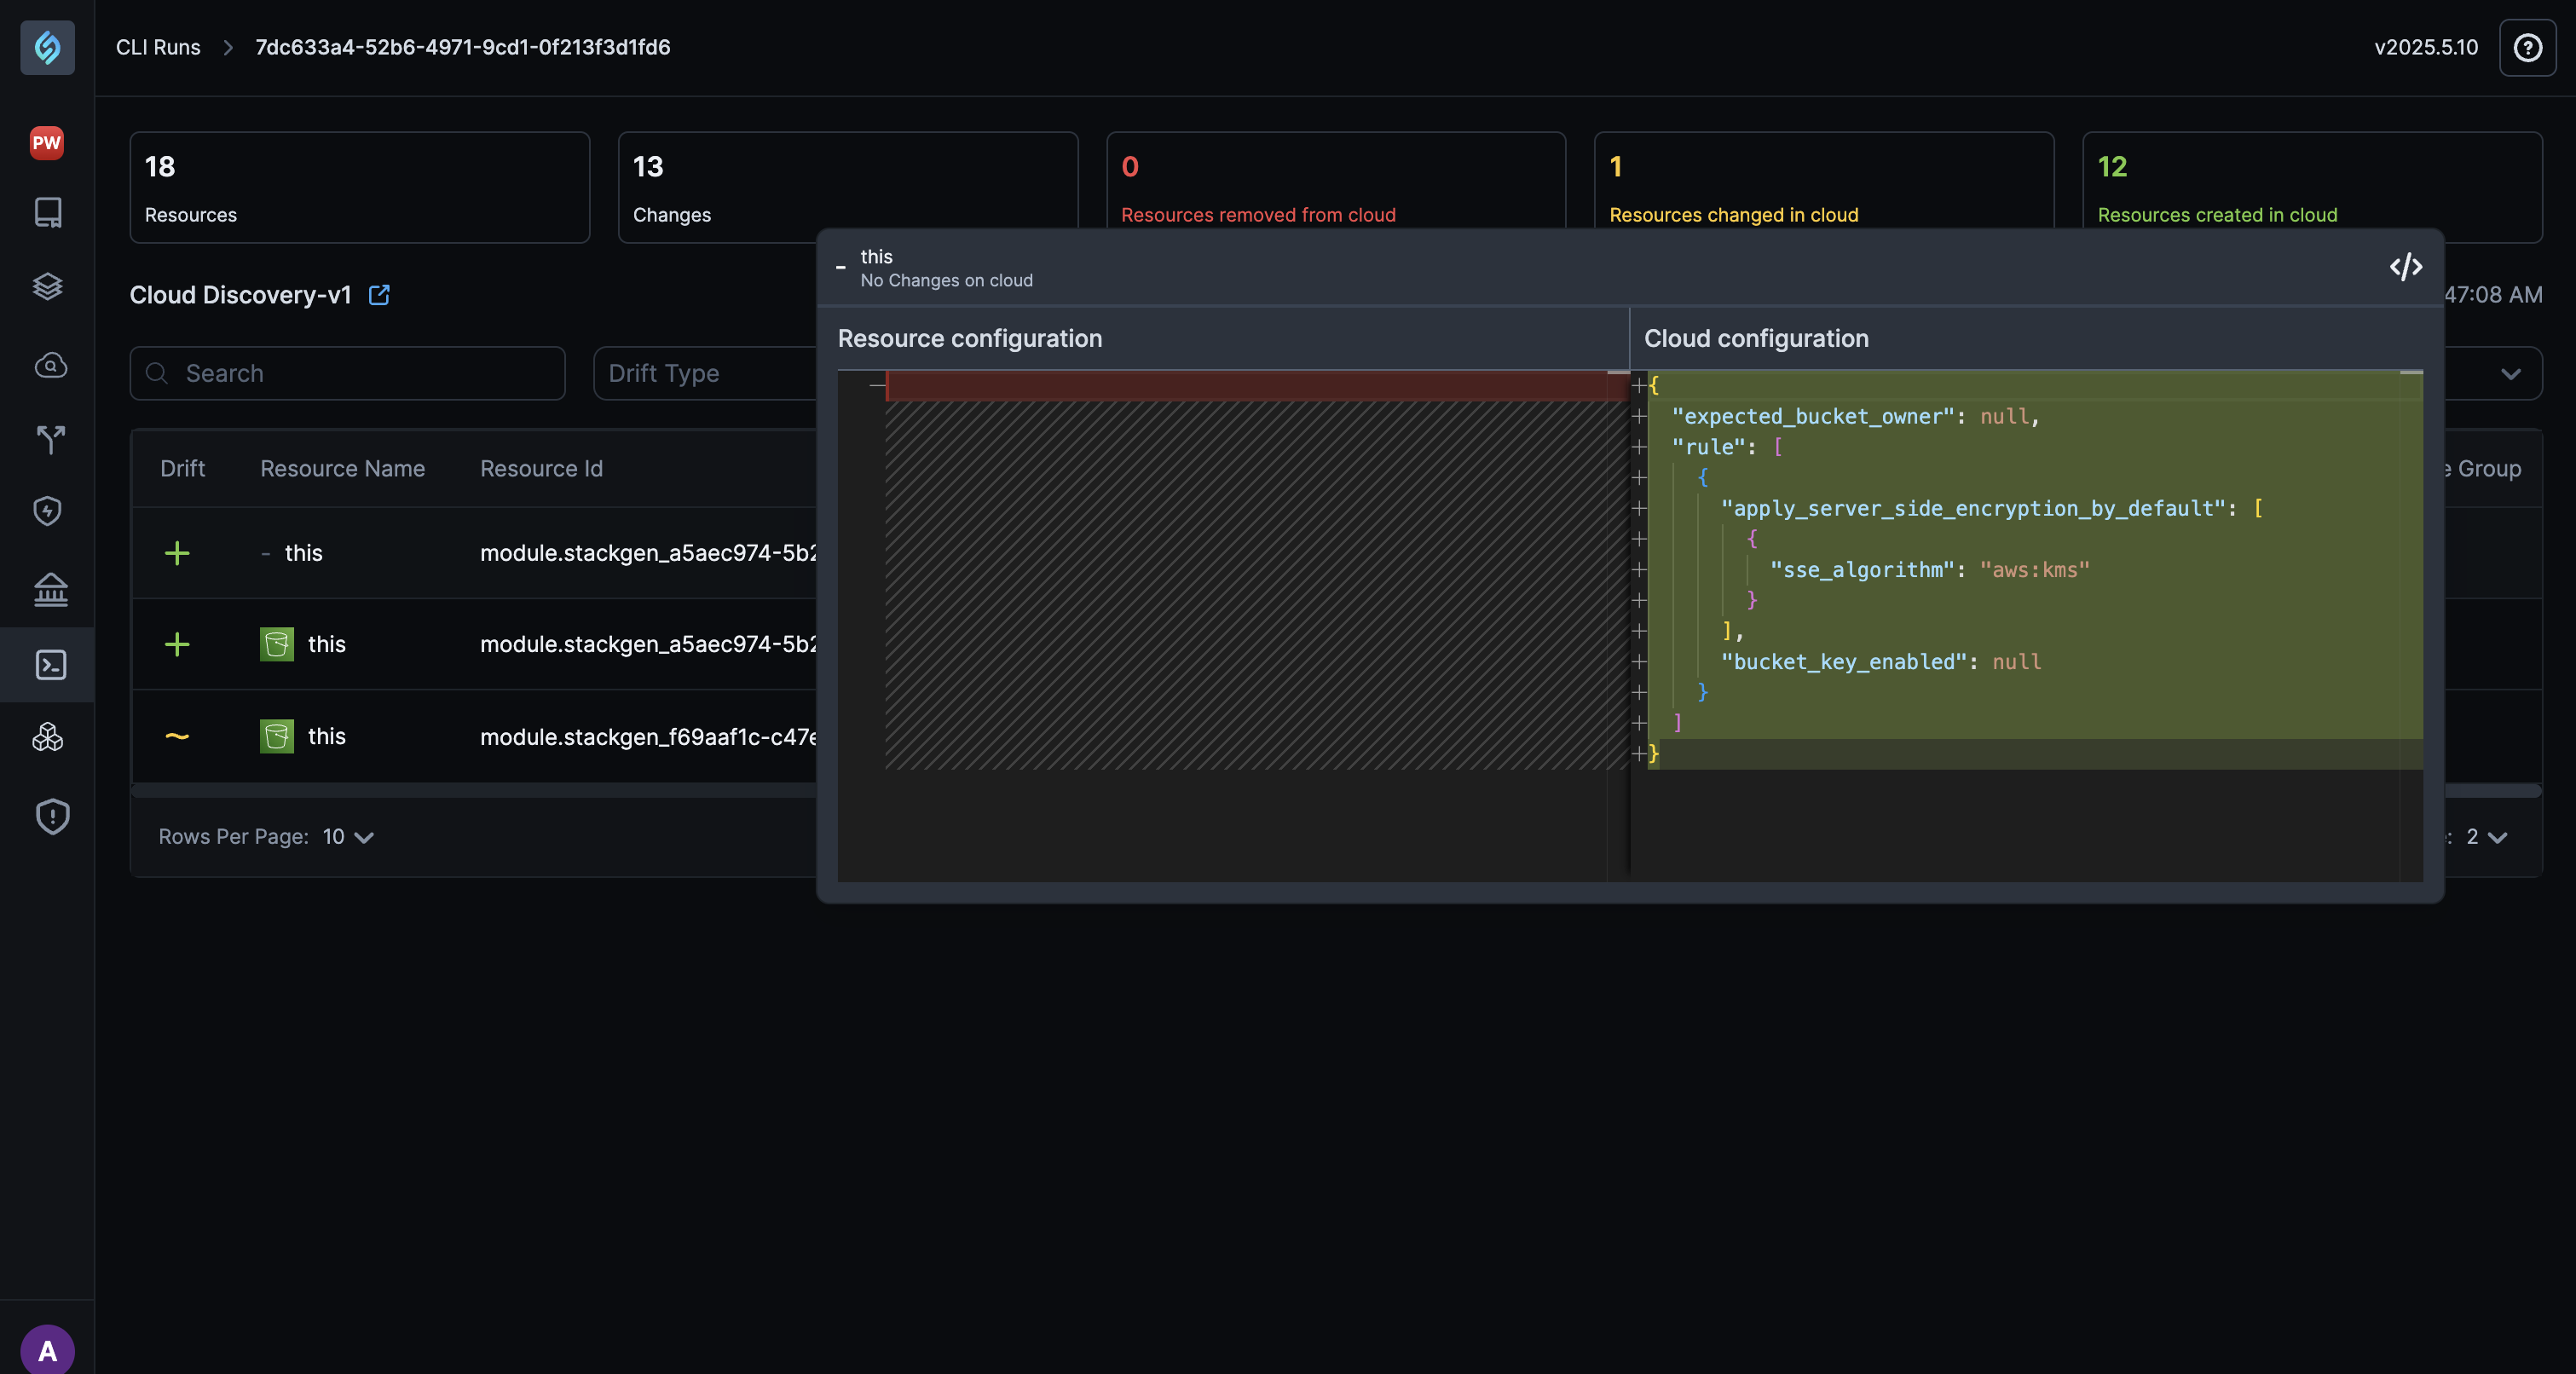
-
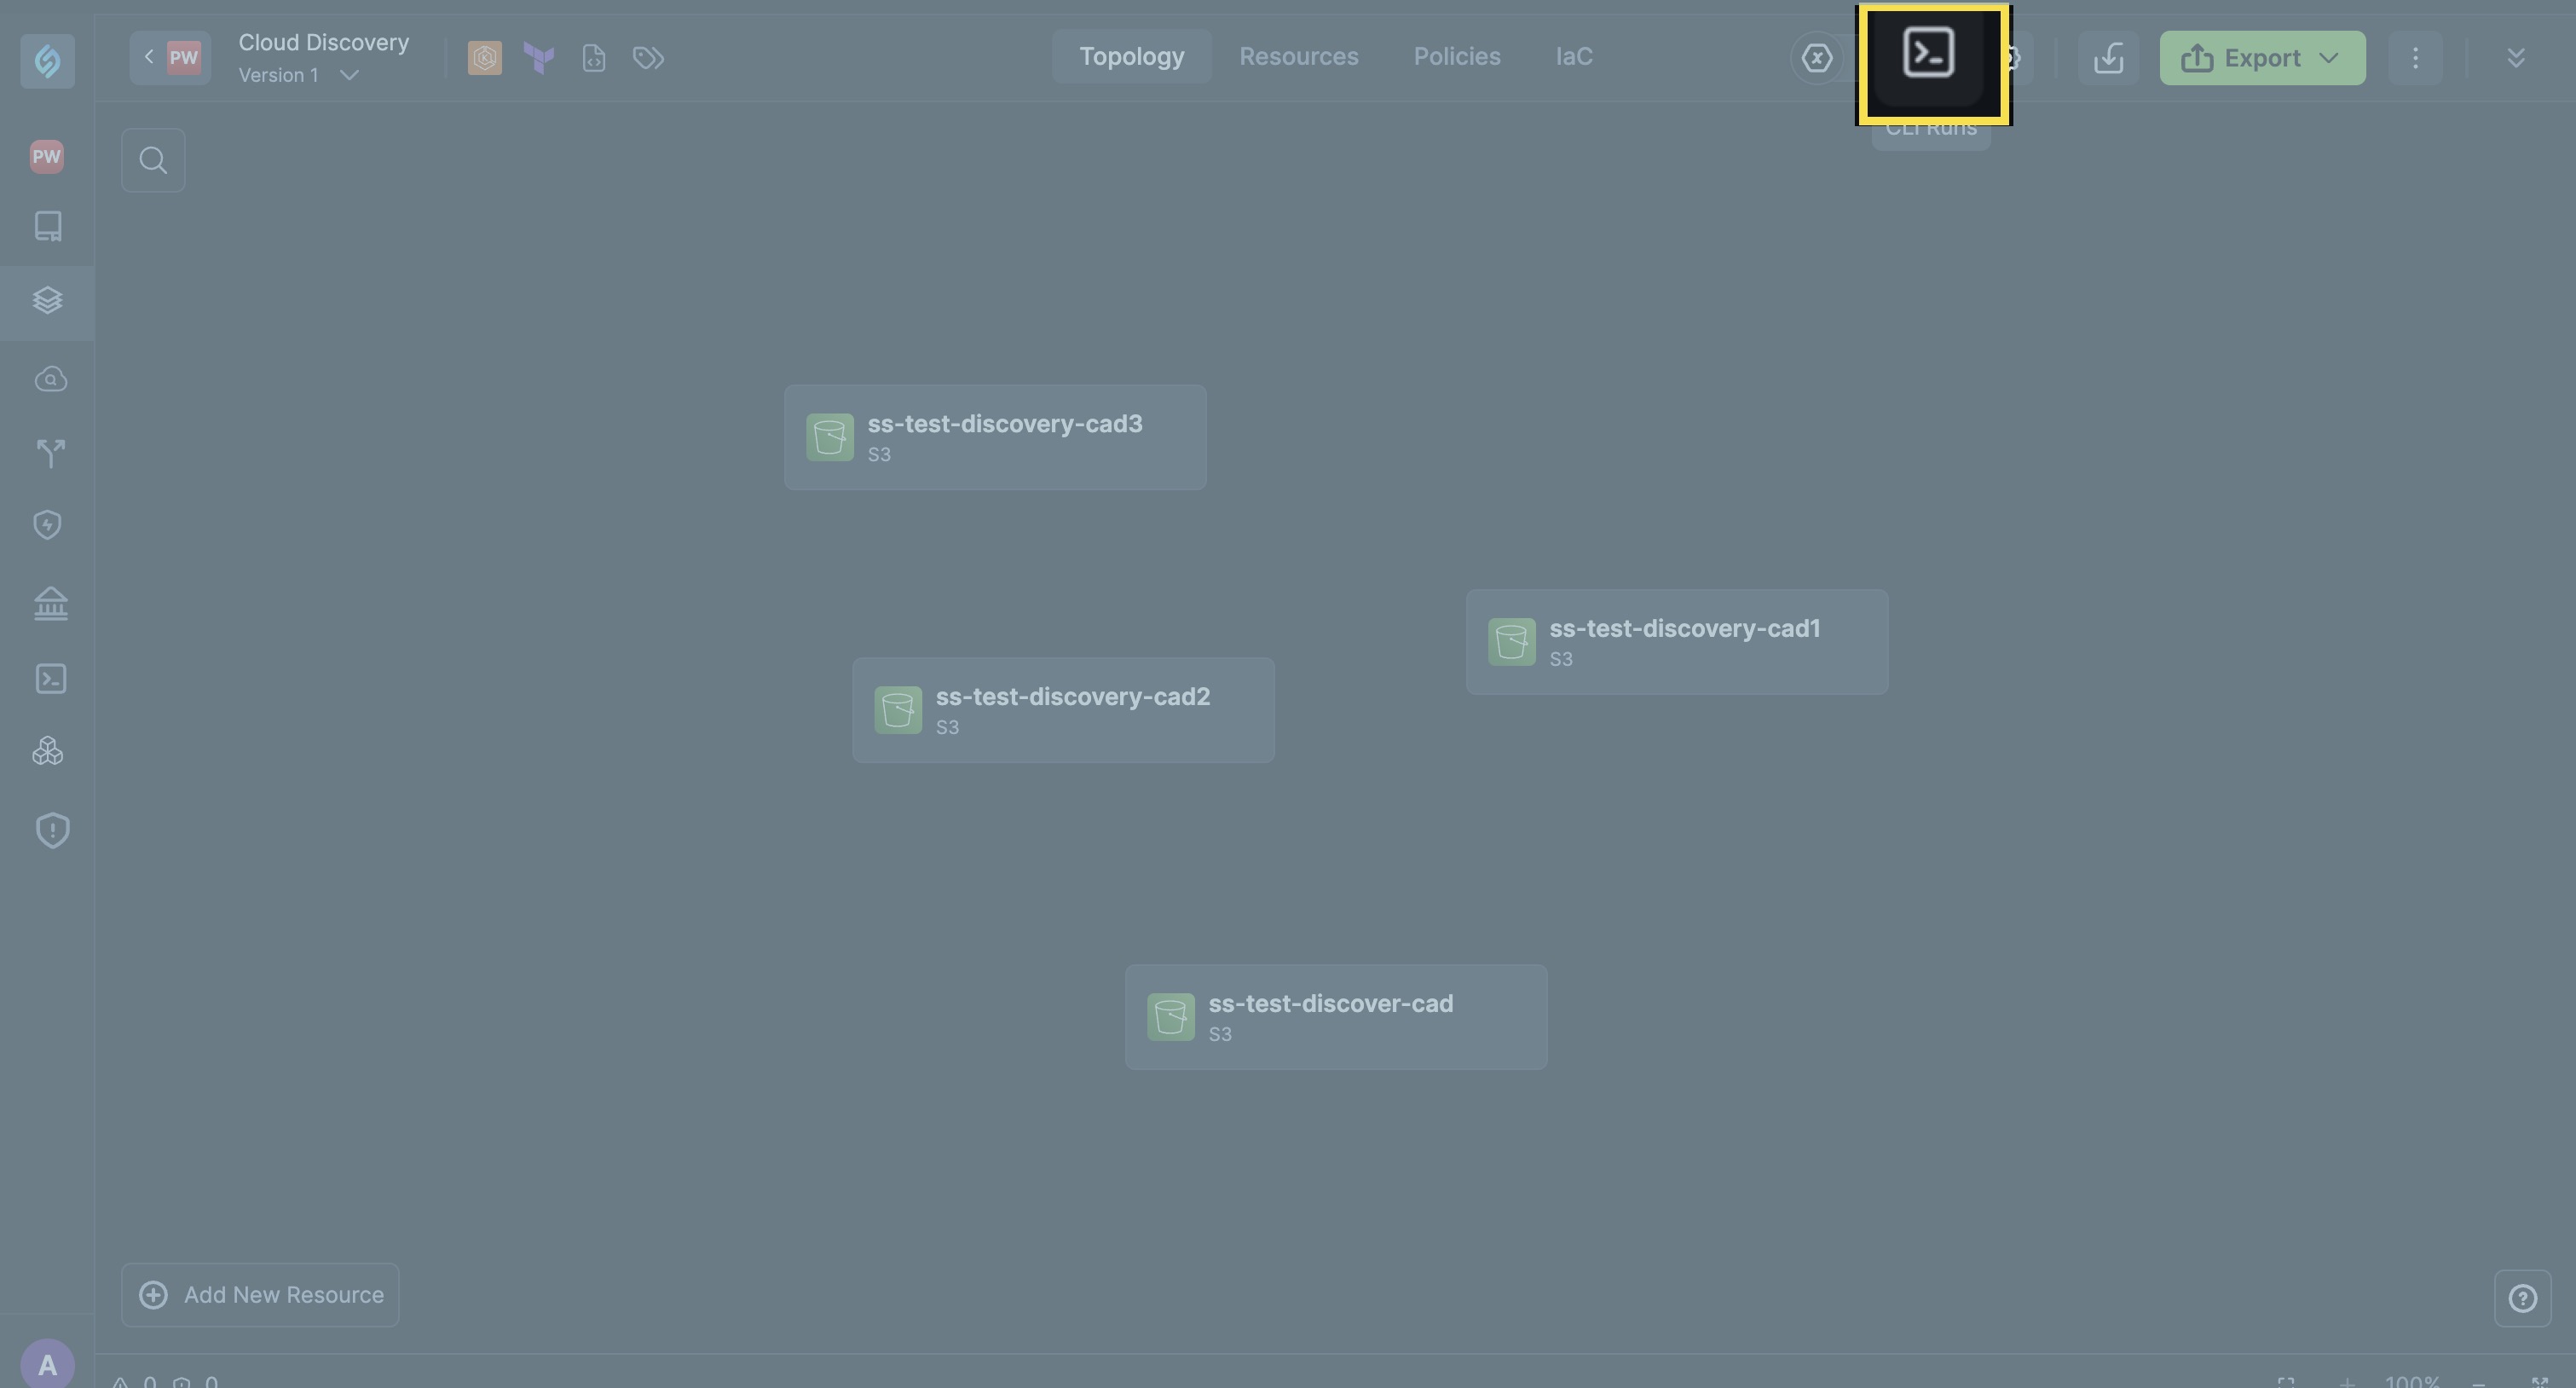
Additionally, you can navigate to CLI Runs from your appStack: