Elastic Container Service (ECS)
Telemetry from Elastic Container Service (ECS) clusters of types Fargate, EC2 or External can be brought into StackGen ObserveNow using an OpenTelemetry sidecar deployment. The sidecar is a lightweight container that runs in each application container of your ECS cluster and collects observability data and forwards it to ObserveNow.
Collecting Logs from ECS
Logs from ECS services are collected using AWS firelens log driver and AWS for fluentbit logs forwarder. The log forwarder is run as an additional container within the same service (aka sidecar container).
Step 1: Add the Log Forwarder Task
Add the following block to your task definition under the containerDefinitions section and redeploy your services. Update the value of awslogs-region to the right region.
Task Definition For The Log Router
...
...
    {
        "name": "opsverse-log-collector",
        "image": "906394416424.dkr.ecr.us-west-2.amazonaws.com/aws-for-fluent-bit:stable",
        "cpu": 250,
        "memory": 512,
        "essential": true,
        "logConfiguration": {
            "logDriver": "awslogs",
            "options": {
                "awslogs-create-group": "True",
                "awslogs-group": "/ecs/ecs-opsverse-log-collector",
                "awslogs-region": "us-east-1",
                "awslogs-stream-prefix": "ecs"
            }
        },
        "firelensConfiguration": {
            "type": "fluentbit",
            "options": {
                "enable-ecs-log-metadata": "true"
            }
        }
    }
...
...
:::
Step 2: Forward App Logs to the Log Forwarder Sidecar
Change the app container's LogConfiguration section to the following:
App's LogConfoguration
            "logConfiguration": {
                "logDriver": "awsfirelens",
                "options": {
                    "Name": "loki",
                    "Match": "*",
                    "Host": "<OpsVerse logs endpoint>",
                    "Port": "443",
                    "tls": "on",
                    "http_user": "devopsnow",
                    "http_passwd": "<logs password>",
                    "tls.verify": "off"
                }
            }
:::
The Opsverse logs endpoint and logs password are available on the StackGen admin console.
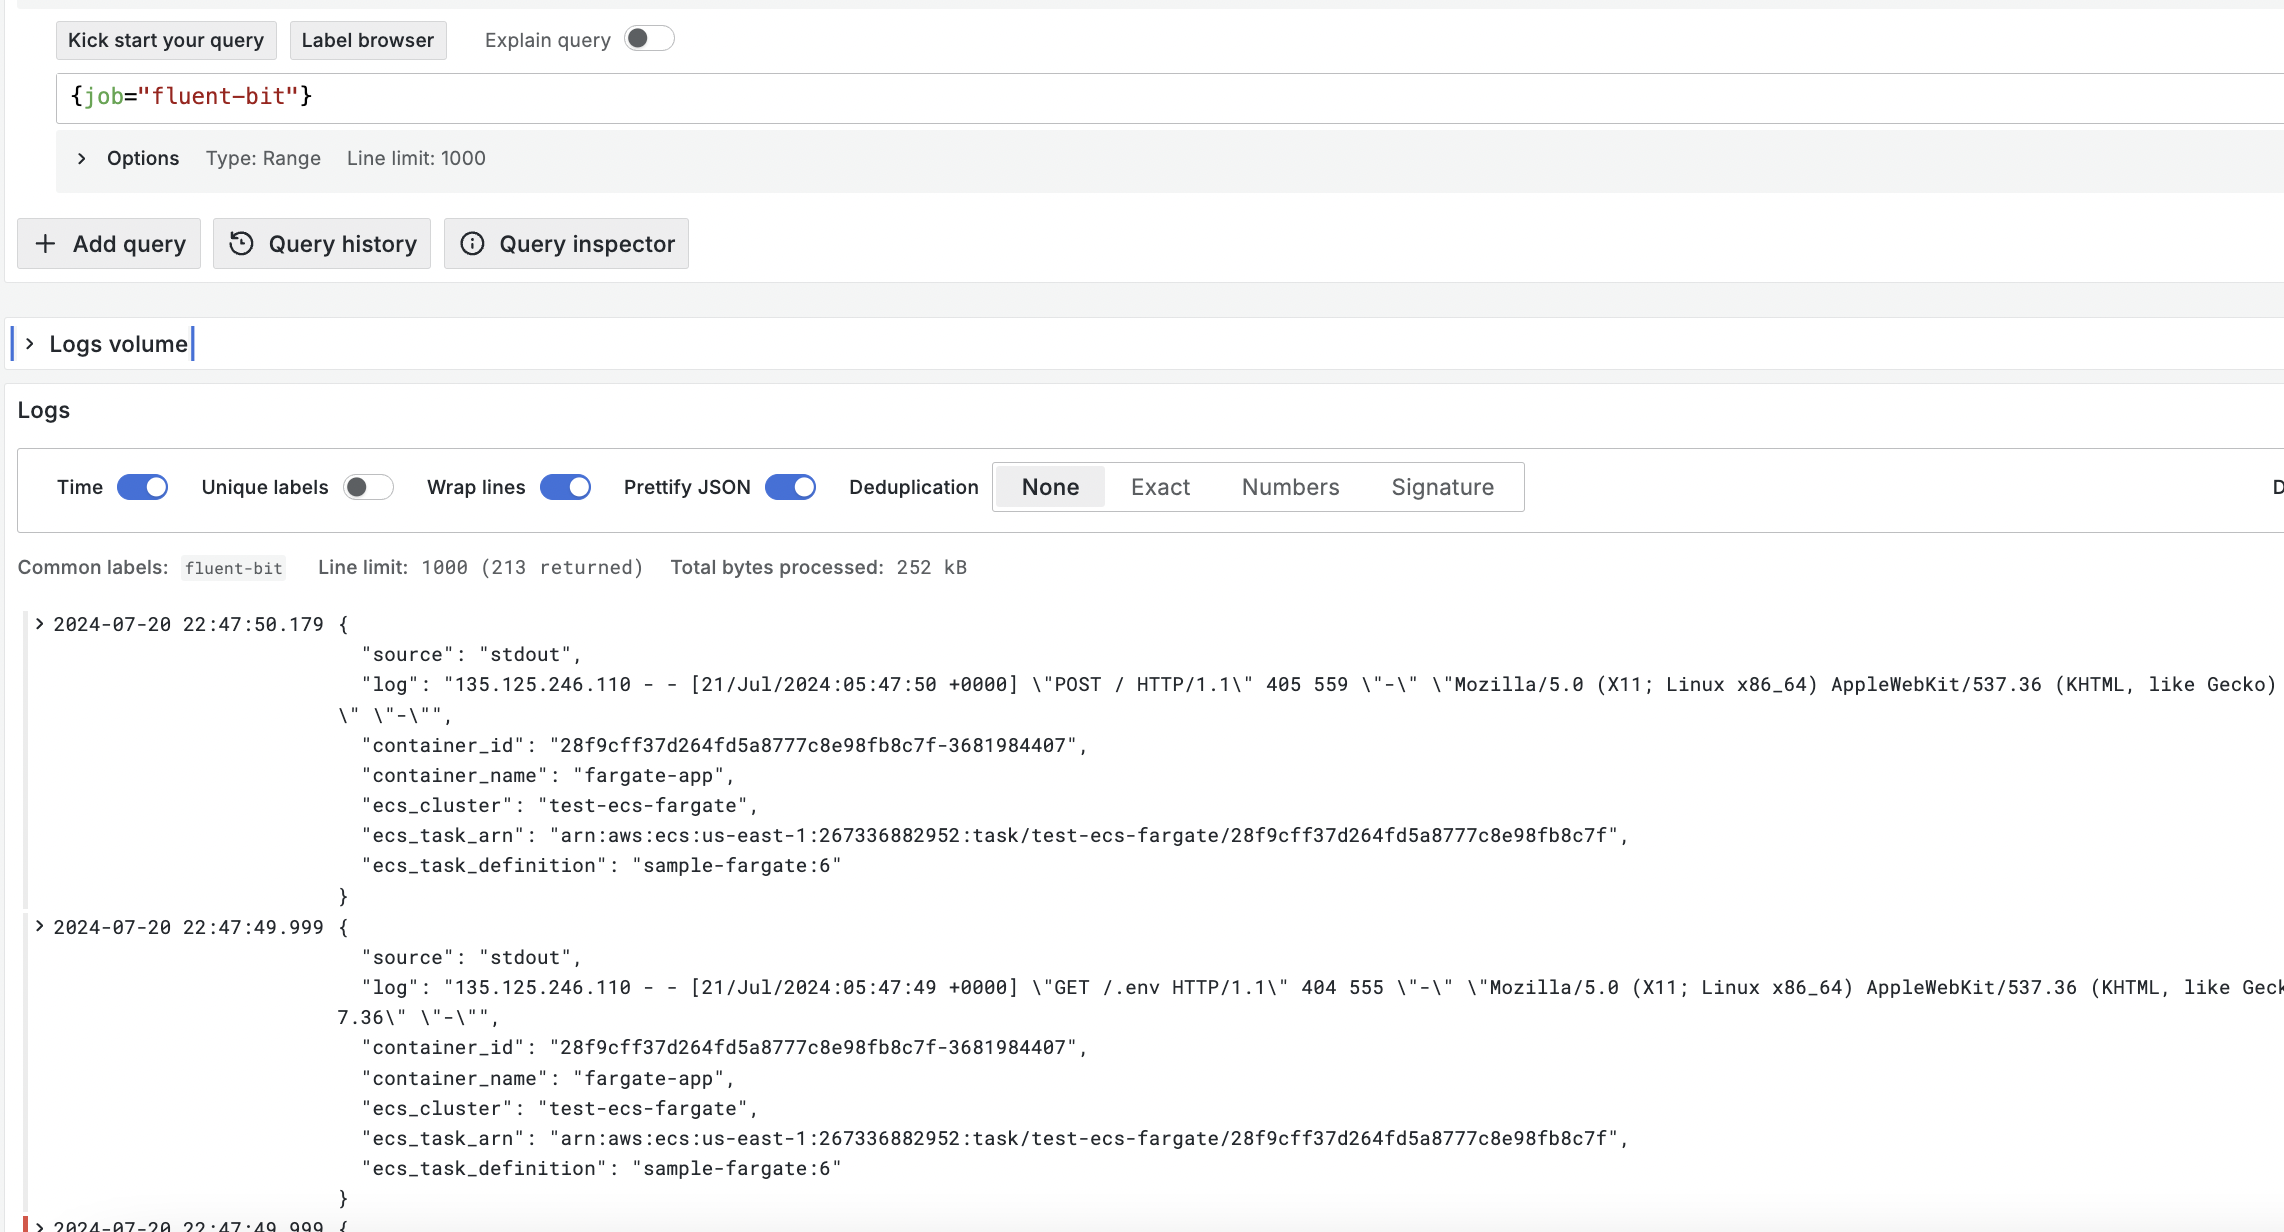
Step 3: View Logs in ObserveNow
Logs collected from ECS can be viewed under the Explore section of the Grafana that is part of ObserveNow. All logs have the label job=fluenbit added to them. This label can be used to easily search for the ECS logs.
Collecting Metrics and Traces From ECS
Container metrics and distributed traces can be collected using the Open Telemetry collector deployed as a sidecar container.
Step 1: Create The OTel Collector Config
The oterl-collector sidecar configuration is managed using a parameter in AWS Parameter Store. Create a new parameter named /ecs/opsverse/otelcol.yaml with the following configuration:
OTel Collector Config
extensions:
  health_check:

receivers:
  awsecscontainermetrics:
    collection_interval: 30s
  otlp:
    protocols:
      grpc:
        endpoint: 0.0.0.0:4317
      http:
        endpoint: 0.0.0.0:4318

processors:
  batch:
    timeout: 30s

exporters:
  otlp:
    endpoint: "<opsverse-otel-endpoint>:443"
    tls:
      insecure: false
    headers:
      Authorization: "Basic Base64{devopsnow:<password>}"
  prometheusremotewrite:
    endpoint: "https://<opsverse-metrics-endpoint>/api/v1/write"
    headers:
      Authorization: "Basic Base64{devopsnow:<password>}"
    resource_to_telemetry_conversion:
      enabled: true
  logging:
    verbosity: normal

service:
  extensions: [health_check]
  pipelines:
    traces:
      receivers: [otlp]
      processors: [batch]
      exporters: [otlp, logging]
    metrics:
      receivers: [otlp]
      processors: [batch]
      exporters: [otlp, logging]
    metrics/aws:
      receivers: [awsecscontainermetrics]
      exporters: [prometheusremotewrite, logging]
    logs:
      receivers: [otlp]
      processors: [batch]
      exporters: [otlp, logging]
:::
Step 2: Update the ecsTaskExecution IAM Role
The sidecar container needs to have access to the AWS Parameter Store and Cloudwatch logs, add the following policies to the ecsTaskExecution role
AmazonSSMReadOnlyAccessCloudWatchLogsFullAccess
Step 3: Add the OTel Collector SideCar Container
Update the task definition to run a sidecar container to run the OpenTelemetry image ( otel/opentelemetry-collector-contrib:0.105.0) with the config created above and redeploy the task definition to start seeing data from your ECS cluster in ObserveNow.
Add the following to the ContainerDefinitions section of the task definition:
...
...
        {
            "name": "opsverse-otel-collector",
            "image": "otel/opentelemetry-collector-contrib:0.105.0",
            "essential": true,
            "command": [
                "--config=env:OTEL_COLLECTOR_CONFIG"
            ],
            "secrets": [
                {
                "name": "OTEL_COLLECTOR_CONFIG",
                "valueFrom": "/ecs/opsverse/otelcol.yaml"
                }
            ],
            "cpu": 256,
            "memory": 512,
            "portMappings": [
                {
                    "protocol": "tcp",
                    "containerPort": 4317
                },
                {
                    "protocol": "tcp",
                    "containerPort": 4318
                }
            ],
            "logConfiguration": {
                "logDriver": "awslogs",
                "options": {
                "awslogs-group": "/ecs/opsverse-otelcol-logs",
                "awslogs-region": "us-east-1",
                "awslogs-stream-prefix": "ecs",
                "awslogs-create-group": "True"
                }
            }
        }
...
...
Edit awslogs-region as required and redeploy the ECS service.
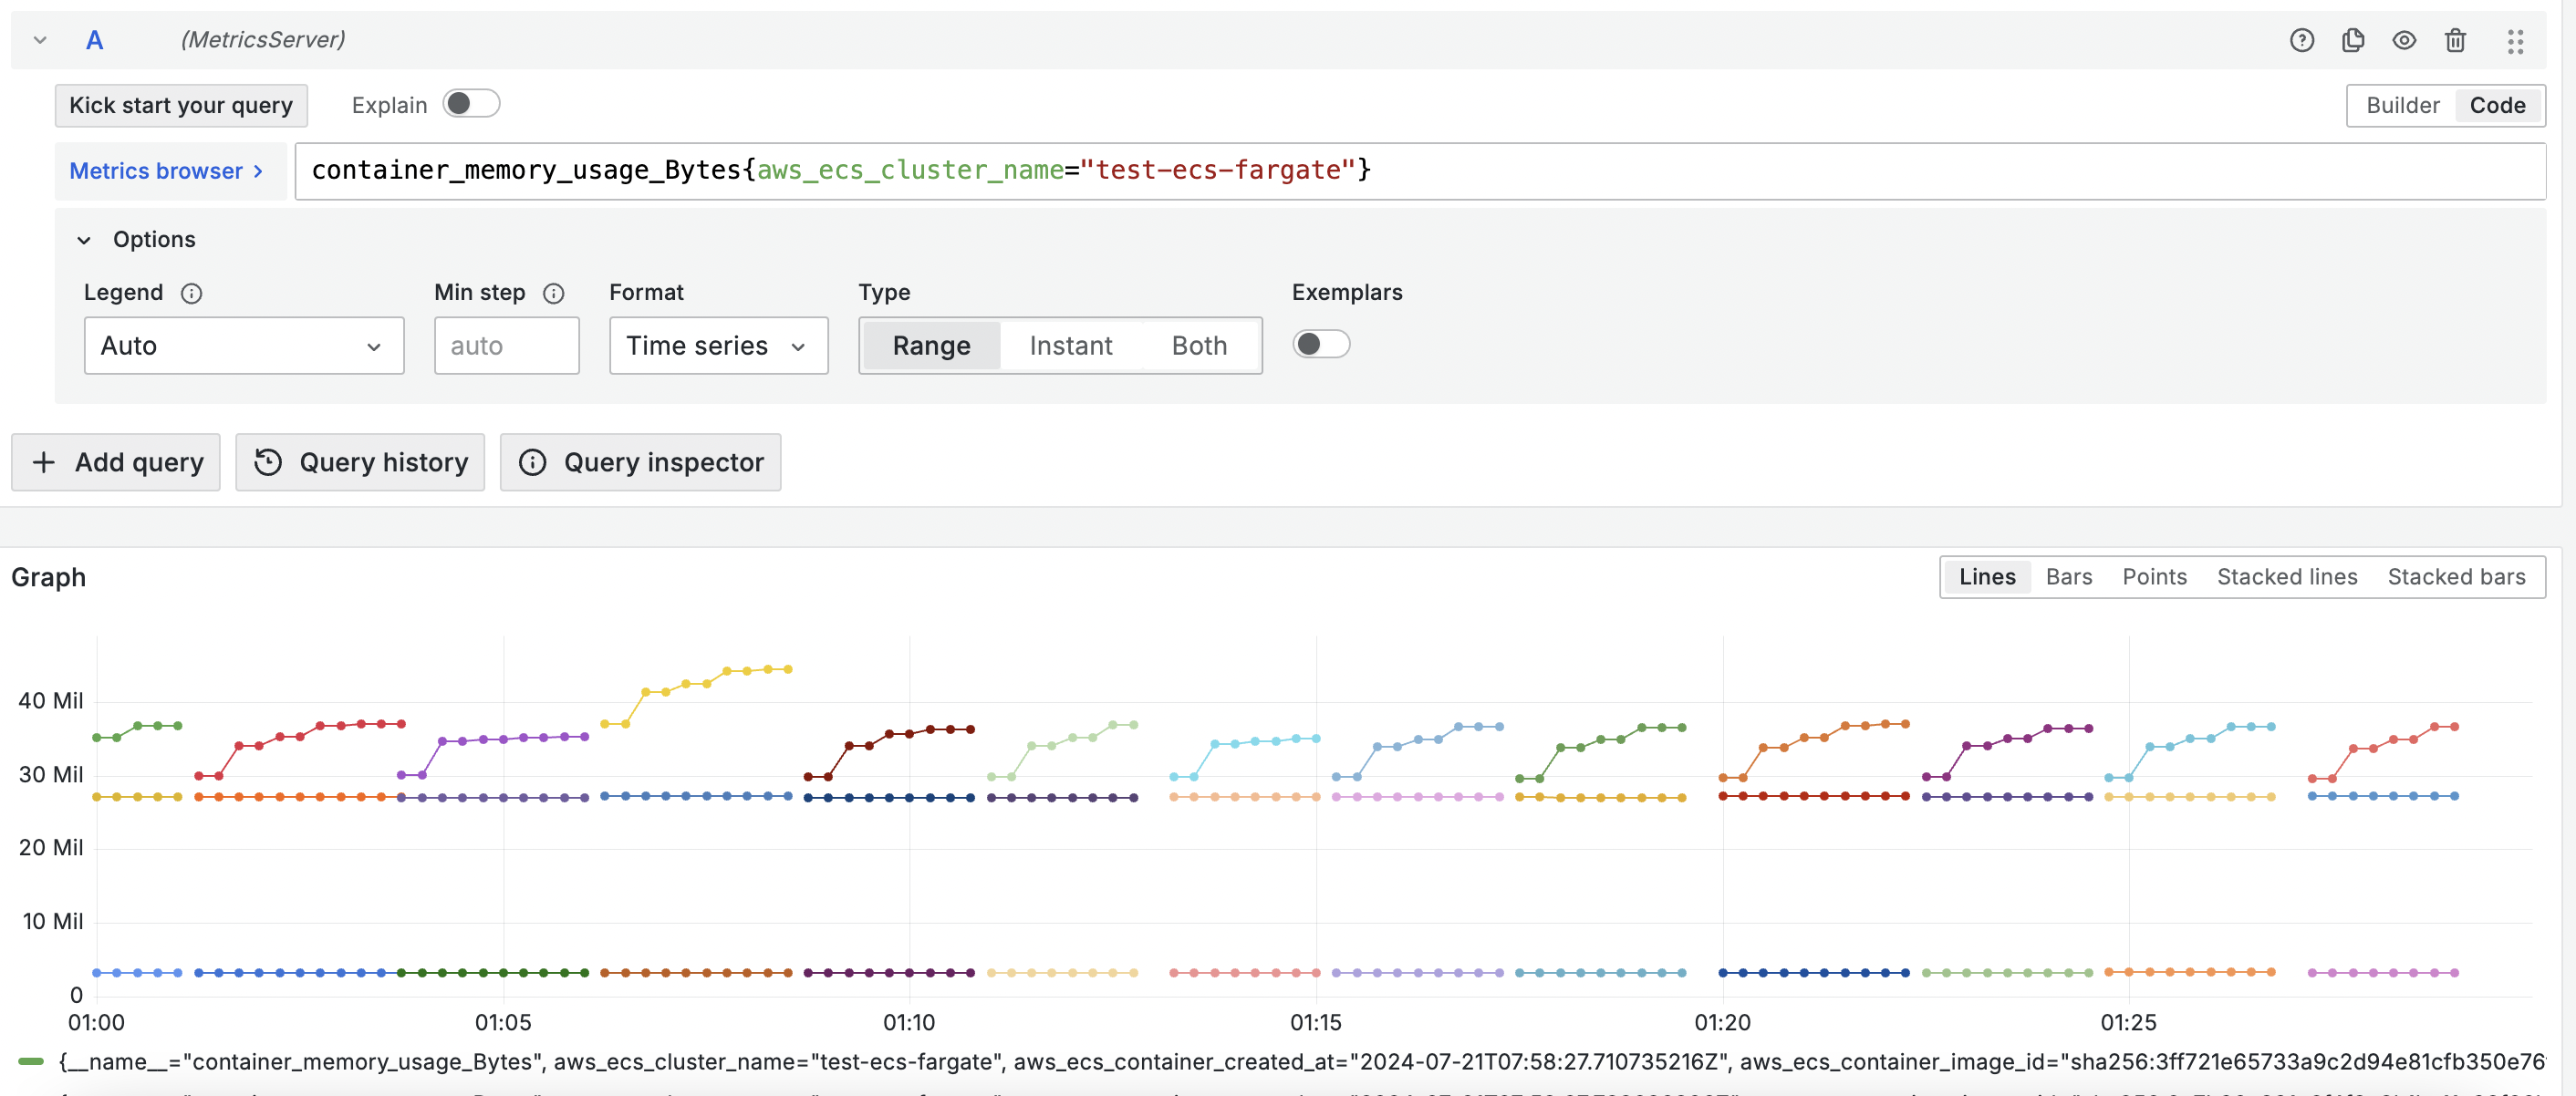
Step 4: View the metrics in ObserveNow
Metrics collected from ECS can be viewed under the Explore section of the Grafana that is part of ObserveNow.
Instrumenting Apps to Send Traces
The above steps install a otel collector that can receive distributed traces from task deployed in ECS. Follow the steps mentioned in the Application section of the documentation to instrument apps using OpenTelemetry. Here are some language specific doc pages:
- Java
- [Javascript (Node JS and Browser)](../../Applications/Javascript Node_JS and Browser)
- [.Net](../../Applications/_NET _ _NET Framework)
- Python
- Go
- Ruby
Following env variables need to be added to the app's container def:
ECS TaskDefinition
            "environment": [
                {
                    "name": "OTEL_EXPORTER_OTLP_ENDPOINT",
                    "value": "http://opsverse-otel-collector:4317"
                },
                {
                    "name": "OTEL_RESOURCE_ATTRIBUTES",
                    "value": "service.name=<service-name>"
                }
:::
For more detailed info about insturmenting using Open Telemetry, please refer to the official Open Telemtry this documentation.